

Training ROI: How to Calculate It, With a Worked Example
How to calculate training ROI with the Phillips formula and benefit-cost ratio, a worked example with fully loaded costs and a range, and when to skip it.

Training ROI (return on investment) is the net monetary benefit of a training programme, after its fully loaded costs are subtracted, expressed as a percentage of those costs. In the Phillips formula, ROI (%) equals net programme benefits divided by programme costs, times 100.
- The benefit-cost ratio divides benefits by costs, so ROI is the ratio minus one, times 100: a ratio of 2.5 is an ROI of 150%.
- Most of the work is in isolating the training's share and converting it to money; the formula itself is one line.
- In my worked example, one eco-driving programme returns anything from a loss of about 19% to a gain of about 245%.
- ROI Institute suggests taking about 5% of programmes to a full ROI study each year, chosen for cost, reach and life span.
- None of 28 workplace course requests typed into Coursebox mentioned the training's return, its cost or how its impact would be measured.
Five questions, about a minute. Answer for one training programme you have been asked to put a return on, such as a sales course, a safety programme or a new system rollout.

Train teams faster and more effectively with AI
I checked the calculations in three published training evaluations for this guide. An Indonesian tax-auditor study reports 65% after dividing net benefit by benefits instead of costs; its stated inputs give about 182% with the Phillips formula. A US sales study reports 137.4% from annualising one month of profit without deducting the training investment. Fixing the arithmetic still leaves the harder question: how much benefit can the study credibly attribute to training?
Training ROI (return on investment) is the net monetary benefit of a training programme, after its fully loaded costs are subtracted, expressed as a percentage of those costs. The formula is one line. The work, and the credibility, sits in four choices behind it: how much of the improvement you credit to the training, how you turn that improvement into money, which costs you count and how long you count the benefits for.
I'm the COO at Coursebox, where we make training management software, so I'll mention our product where I tested it. From the COO's chair, a single ROI percentage tells me less than the assumptions under it. I work one eco-driving programme for truck drivers through all six steps of the Phillips method, then show where three published studies went wrong.
What is training ROI?
Training ROI (return on investment) is the net monetary benefit of a training programme, after its fully loaded costs are subtracted, expressed as a percentage of those costs. It answers the question a finance team asks about any spend: for each dollar spent, how much more came back?
Jack and Patti Phillips give two formulas in the first chapter of ROI Basics, their ATD Press handbook on the method:
- ROI (%) = (programme benefits minus programme costs) ÷ programme costs × 100
- Benefit-cost ratio (BCR) = programme benefits ÷ programme costs
The two describe the same result in different ways. The ratio compares everything that came back with what went in. ROI compares only the gain with what went in. So ROI is always the ratio minus one, times 100. A ratio of 2:1 is an ROI of 100%, and the Phillipses warn that anyone reporting "a BCR of 3:1 and an ROI of 300 percent" has made a mistake: "This is not possible."
This table reads one simple illustration three ways: a programme that cost $10,000 and returned $25,000 in the first year.
| Measure | How to calculate it | Reading for $25,000 back on $10,000 spent |
|---|---|---|
| ROI | (benefits minus costs) ÷ costs × 100 | 150%: a net gain of $15,000 on $10,000 spent |
| Benefit-cost ratio | benefits ÷ costs | 2.5: $2.50 back for every $1, of which $1.50 is gain |
| Payback period | costs ÷ benefit per month | about 4.8 months, if the $25,000 arrives evenly over the year |
The phrase "$2.50 back for every dollar" is where most confusion starts, because it does not say whether the dollar you spent is inside the $2.50. Give the ROI and the ratio side by side and the reader never has to guess.
Where ROI sits: Phillips's five levels
ROI is the fifth level of the Phillips ROI Methodology. Jack Phillips took the four-level idea of training evaluation and, as ROI Basics puts it, "added the economic theory of cost-benefit analysis" so that a return could be reported to senior leaders. He set the framework out in his Handbook of Training Evaluation and Measurement Methods, first published in 1983, and ROI Institute publishes the method today.
The ROI Institute's description of the methodology names five levels plus intangible benefits:
| Level | Name | The question it answers | Typical evidence |
|---|---|---|---|
| 1 | Reaction and planned action | Did people find it relevant, and what do they plan to change? | A short survey at the end, with an action plan |
| 2 | Learning | Can they do it now? | An observed skill check or a test |
| 3 | Application and implementation | Are they doing it at work? | On-the-job observation, system records |
| 4 | Business impact | Did a business measure move? | Output, quality, cost or time records |
| 5 | Return on investment | Was it worth the money? | ROI and benefit-cost ratio |
| Intangibles | Benefits not converted to money | What else improved? | Reported beside the ROI, not inside it |
The levels describe a proposed chain from learning to application and business impact; progression is not automatic. Plan the impact measure and evidence before building the programme, then check whether people learned and applied the intended skills. A Level 5 estimate without application evidence gives little explanation of how the result arose. Report benefits that have not been converted to money beside the ROI, because a positive percentage is not the whole judgement.
If you know Kirkpatrick's four levels (reaction, learning, behaviour and results), Levels 1 to 4 will look familiar. Level 5 is Phillips's addition, not Kirkpatrick's. Our guide to the Kirkpatrick model covers the four levels and why planning starts from results; this page picks up where the money comes in.
When is training ROI worth calculating?
A full ROI study takes analyst time, data from outside the training team and a sponsor willing to wait months for the answer. ROI Institute says that "Only certain programs require such comprehensive evaluation" and names the ones that do:
- very expensive programmes
- programmes with a long life cycle
- programmes with a broad reach
- comprehensive programmes
- programmes that bring significant change to the organisation
How many is that? In a 2022 ROI Institute presentation by Patti Phillips, the recommended targets are 10% of programmes evaluated at business impact each year and 5% at ROI. The Institute's 2009 workbook, The Bottom Line on ROI, said ROI studies usually involve "5-10% of projects and programs". Both are practitioner recommendations from the method's owners, not research findings, but they point the same way: ROI is for the few programmes big enough to justify the effort.
In the CIPD's 2021 survey of learning professionals, most did not get as far as Level 4: 76% said they evaluated their learning initiatives in some way, but the commonest method was participant satisfaction.
In the CIPD's Learning and Skills at Work report, only 13% assessed whether behaviour changed on the job. If your organisation looks like that, the first ROI study is also the first time anyone has collected Level 3 and Level 4 data on purpose, and the data plan is most of the job.
I would usually skip a full ROI study for a small one-off session if the evaluation would cost more than the decision warrants, or postpone it when no business measure can be named. Required compliance training still needs learning, application and control checks. ROI can compare lawful delivery options or examine benefits, but a low return does not decide whether the business can omit a required programme. Report the evidence needed for the actual decision.
How to calculate training ROI, step by step
The six steps here are the Level 5 process ROI Institute describes: identify the improvement, isolate the training's share, convert it to money, count the fully loaded costs, list the intangibles and compare benefits with costs. To show what each step involves, I carry one programme through all six.
The example is hypothetical and every figure in it is illustrative. A refrigerated road freight company runs overnight linehaul between east-coast capitals from two depots, A and B, with about 120 drivers in total. Fuel is its largest controllable cost after wages, and fuel used per 100 km has drifted up. The fleet manager wants fuel-efficient driving training. The finance director asks what it will return.
The programme targets four habits: anticipating traffic to avoid hard braking, smooth acceleration, using cruise control on the highway where safe, and switching the engine off when parked longer than the company's idle limit. The 60 drivers at Depot A go first, through three parts:
This is an illustrative training brief. Safe driving and the company’s approved procedures take priority over fuel targets. Engine-off decisions must account for refrigeration and other required power; cruise control and braking depend on the conditions. A fuel metric alone cannot establish safe performance.
- Classroom: a 4-hour session with an external trainer, run as four sessions of 15 drivers.
- Online: a 1-hour course on the four habits.
- Coaching ride: one 3-hour ride with the company's driver trainer on a normal paid run, using a coaching checklist.
Depot B's 60 drivers are trained six months later, so for the first six months they are a comparison group. That is why this example shows the method well: the business measure already exists, a second depot makes isolation possible, and drivers' time is a large cost that is easy to forget.
Step 1: Pick the business measure and record the change
Start from a measure the business already collects, with a baseline from before the training, and decide it before the programme starts. If you need help choosing, our list of training KPIs covers the usual candidates. Collect the lower levels too. Phillips's guiding principles, the rules ROI Institute uses to keep a calculation conservative, start with this one: "When conducting a higher-level evaluation, collect data at lower levels." Level 3 data is what explains a Level 4 result.
For the depot programme, the chain of evidence looks like this:
- Level 1: drivers rate the programme's relevance and write down what they plan to change.
- Level 2: a structured skill check during coaching records the four habits. It shows performance under those supported conditions; the normal work ride can also provide an initial application observation.
- Level 3: six months of telematics on idle time, braking and suitable highway cruise-control use, interpreted with route and safety context rather than treating every braking event as a failure.
- Level 4: fuel used in litres per 100 km, from telematics and fuel cards.
Six months after training, the Level 4 numbers look like this:
| Fuel used | Depot A (trained) | Depot B (not yet trained) |
|---|---|---|
| Average over the 12 months before training | 50.0 L/100 km | 50.0 L/100 km |
| Average over the 6 months after training | 47.8 L/100 km | 49.4 L/100 km |
| Change | 2.2 L/100 km lower | 0.6 L/100 km lower |
Step 2: Isolate the training's share
Fuel use at Depot A fell by 2.2 L/100 km, a 4.4% drop. Not all of that is the training. Cooler weather, a fleet-wide tyre change and a company-wide fuel campaign affect both depots. Guiding principle 5 says "Use at least one method to isolate the effects of a project", and ROI Institute lists the options: a control group, trend line analysis, forecasting, estimates from participants or managers, previous studies, the impact of other factors and customer input.
For the depot programme:
- Depot A change: 2.2 L/100 km lower.
- Depot B change over the same months: 0.6 L/100 km lower.
- Attributed to training: 2.2 minus 0.6 = 1.6 L/100 km, a 3.2% drop on the 50.0 baseline.
- Main threat: the depots are similar, not identical, with different routes, trucks and managers.
The comparison estimates a 1.6 L/100 km contribution under the assumption that the depots would otherwise have changed similarly. Check pre-training trends, season, loads, routes, trucks and concurrent changes. A second depot improves the design; it does not prove that every remaining difference was caused by training.
When there is no comparison group, the usual fallback is to ask participants. Each person estimates what share of their improvement came from the training, then says how confident they are in that estimate, and the two are multiplied. In the Phillipses' own worked table, a participant who credits 60% of an improvement to the programme with 80% confidence contributes 48%. Guiding principle 7 says "Adjust estimates of improvement for potential errors of estimation", and the confidence factor is how.
As a cross-check, the average of each driver’s attributed share multiplied by their own confidence is 76%. A driver who says 90% with 80% confidence contributes 72%. Applied to the 2.2 L/100 km observed change, 76% gives 1.672 L/100 km. I use the comparison estimate of 1.6 for the base case, while acknowledging its assumptions. Confidence adjustment is a conservative heuristic, not a statistical confidence interval or proof of attribution.

Case study: Tax auditor training in Indonesia's tax office
Indonesia's Directorate General of Taxes ran its intermediate tax auditor training in 2011 for 427 auditors, in five batches of 10 days each. Supervisors assign auditors' workloads, so output records could not show what the training changed.
- What they did: About a year after the training, the evaluators surveyed the auditors and evaluated the programme at Phillips Levels 3 to 5. Respondents estimated how much they had improved and how confident they were, and each estimate was multiplied by its confidence, so 80% at 70% confidence counted as 56%. A rise in audit reports was left out because it was too hard to value.
- Evidence and result: In Jayani and Yamazaki's 2012 working paper, first-year benefits valued against salary came to about Rp 13.3 billion and costs to about Rp 4.7 billion, including participants' salaries for the training days. The paper reports "an ROI of 65 percent". Its printed calculation divides the net benefit by the benefits. Divided by the costs, as the formula requires, the same numbers give a benefit-cost ratio of 2.82 and an ROI of 182%.
- Limitation: Only 113 auditors (26.5%) returned the survey, the estimates are self-reported, and the three benefit streams (better performance, time saved and fewer errors) all convert through salary, so they may overlap. Design costs were left out for lack of records. It is a working paper, not peer reviewed.
- Lesson: Confidence-adjusted estimates are a workable method in a public agency with no comparison group. Check every published ROI against the ratio minus one, times 100: here that check moves the answer from 65% to 182%.
Step 3: Convert the improvement to money
Converting a measure to money is where most ROI figures are won or lost. ROI Institute's options include standard values for output, quality and time, historical costs, internal and external experts, external databases and estimates. Conversion is selective: the Institute says "Not all Level 4 measures need to be converted to money; some will be reported as Intangible Benefits."
Use incremental profit contribution or cost saved rather than sales revenue alone, and avoid counting the same gain twice. State the evaluation period and keep benefit and cost coverage consistent. Phillips’s first-year convention for short-term programmes is a reporting choice, not a ban on multi-year appraisal. For a longer-lived investment, finance may also need discounted cash flows and the costs of sustaining the benefit.
Fuel is a cost, so the depot programme converts with a standard value, the company's net cost per litre:
- Drivers counted: 54, because six of the 60 left within the year. Guiding principle 6 says to assume no improvement where there are no data, so they are left out of the benefits and their training costs stay in.
- Distance: 150,000 km per driver per year, 8,100,000 km in total.
- Saving per 100 km: an estimated 1.6 L for months 1 to 6, then an assumed 0.8 L for months 7 to 12. With equal distance in each half-year, the average is 1.2 L for the year.
- Litres saved in year one: 8,100,000 ÷ 100 × 1.2 = 97,200 L.
- Value: 97,200 L × $1.60 a litre = $155,520.
The second-half saving is a forecast, not a finding. Depot B is trained after month 6, so it no longer supplies an untreated comparison. For this illustration I assume the saving halves and distance is evenly distributed through the year. Retaining-driver mileage is 150,000 km each; unrecorded benefits from leavers are excluded, although any recorded pre-departure savings could be counted in a real evaluation. Finance should replace the $1.60 net fuel cost with its own applicable figure.
Step 4: Count the fully loaded costs
Guiding principle 10 says "Fully load all costs of a solution, project, or program when analyzing ROI." ROI Institute lists needs assessment, design and delivery, facilitation, participation and evaluation, and its own wording for the aim is "a conservative estimate of program costs". Participants' time is the line most often missing, because it never arrives as an invoice. For the onboarding version of this sum, see our breakdown of the average cost of training a new employee.
The depot programme has 10 cost lines, all for the 60 Depot A drivers:
| Cost line | Basis | Amount |
|---|---|---|
| Needs assessment | Fleet manager and telematics analyst, 40 hours at $100 an hour loaded | $4,000 |
| Design and development | Adapting an eco-driving module, building the online course and the coaching checklist, charged in full to the pilot | $12,000 |
| Classroom delivery | External trainer, 4 sessions at $1,800 | $7,200 |
| In-cab coaching | Driver trainer, 60 rides × 3 hours × $65 an hour loaded | $11,700 |
| Participants' time | 60 drivers × 5 hours (4 classroom, 1 online) × $58.50 ($45 wage plus 30% on-costs) | $17,550 |
| Venue, catering and materials | Four classroom sessions | $2,400 |
| Telematics report set-up | Driver fuel and behaviour reports | $1,500 |
| Online course hosting | Year-one share | $1,800 |
| Coordination and administration | Rostering and bookings | $3,000 |
| Evaluation | Analyst time, survey and report | $4,500 |
| Total | $65,650 |
The needs assessment is the work of establishing that fuel use, not something else, was the problem worth training for. A training needs analysis questionnaire is one way to run it. One thing is deliberately not counted: drivers' time on the coaching ride. They drove a normal paid run carrying freight, so no working time was lost. The driver trainer's time on the ride is counted. If the ride had been an extra run with no freight, the truck and the driver's hours would go in.
Step 5: List the intangible benefits
Some benefits are real but not worth forcing into dollars. The method defines them precisely: "Define intangible measures as measures that are purposely not converted to monetary values." For the depot programme, the intangibles report beside the ROI:
- Safety: report braking and speeding measures with their context; fewer recorded events alone do not establish fewer accidents.
- Fuel volume: an estimated 97,200 litres avoided under the base assumptions. An emissions estimate needs an applicable conversion factor; litres alone are not an emissions measure.
- Wear: brake and tyre replacement intervals.
- Drivers' view: what they said about the coaching ride.
Fewer harsh braking events may well be worth more to the business than the fuel. Putting a dollar figure on a crash that did not happen would invite an argument about the figure instead of the result.
Step 6: Compare the benefits with the costs
For the depot programme in year one:
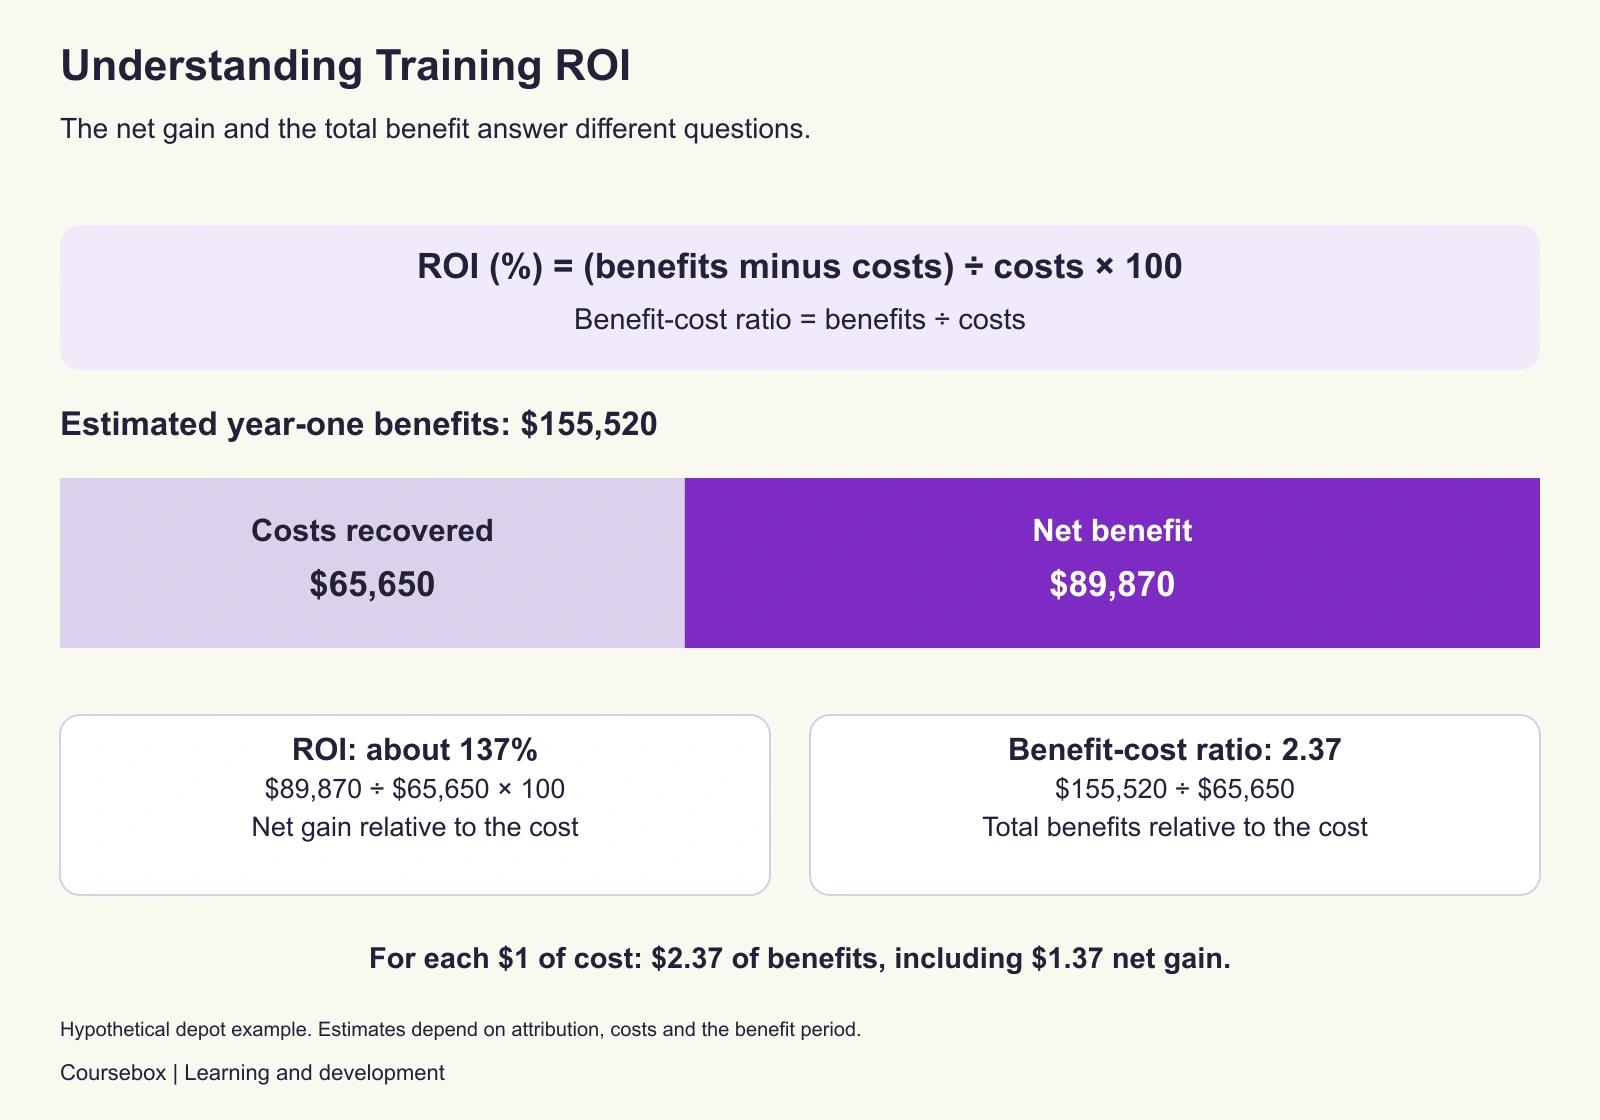
- Net benefit: $155,520 minus $65,650 = $89,870.
- ROI: $89,870 ÷ $65,650 × 100 = 136.9%, reported as about 137%.
- Benefit-cost ratio: $155,520 ÷ $65,650 = 2.37, so every $1 spent returned $2.37 in fuel savings, $1.37 of it net.
- Check: (2.37 minus 1) × 100 = 137, so the two figures agree.
- Payback: a little under four months, because the saving is largest in the first six months, at $17,280 a month.
Never write this result as "a 237% return". That is the ratio dressed up as an ROI, the exact error the Phillipses call not possible.
A filled calculation, ten cost lines, low/base/high assumptions and a blank page for your own programme. The depot figures are hypothetical. A planning aid, not a validated evaluation instrument. Editable Word file, no email required.

Case study: A credit union's adviser qualification in Ireland
A credit union with 25 employees put seven staff through the Qualified Financial Adviser (QFA) programme, a visiting lecturer teaching in the boardroom after hours on the staff's own time. Only QFA-qualified staff may sell insurance, so the question was what the qualification returned to the organisation.
- What they did: One year after the course, the evaluation went straight to Level 5, using financial records and interviews with the lending manager, the chief executive and a director. It counted one benefit, insurance sales, because "only QFA qualified staff can sell insurance and it was the most conservative estimate." A €500,000 fall in the bad debt provision and lower absenteeism were reported as intangibles, not counted.
- Evidence and result: In McDonagh's 2016 master's thesis at the National College of Ireland, insurance brought in €60,000 over twelve months against reported organisational costs of €25,700: lecturer €7,500, QFA membership €1,050, travel and subsistence on exam days €4,900 and exams €12,250. The thesis reports a benefit-cost ratio of 2.33 and an ROI of 133.46%, and the two agree.
- Limitation: Seven people, one organisation and a thesis rather than a peer-reviewed paper. The €60,000 is revenue, not the margin on it, and the author concedes sales might have reached the same level anyway. The thesis assigns no employer wage cost to unpaid after-hours training. Learners’ time still has an opportunity cost, so call this the reported organisational-cost perspective rather than a complete economic costing.
- Lesson: The thesis reconciles its reported ratio and ROI and limits the benefit streams. That does not validate attribution, the use of revenue or the missing value of learners’ time. Use it to check the arithmetic and to identify what a stronger evaluation would need.
How sure is the number? Show a range, not a point
The 137% rests on assumptions, and finance will ask which ones carry the weight. A sensitivity table answers before they ask. Each row changes one input and keeps everything else at the base case:
| Scenario | Litres saved | Benefit | Cost | ROI | Benefit-cost ratio |
|---|---|---|---|---|---|
| Base case | 97,200 | $155,520 | $65,650 | 137% | 2.37 |
| No fade: 1.6 L/100 km held all year | 129,600 | $207,360 | $65,650 | 216% | 3.16 |
| Full fade: saving stops after month 6 | 64,800 | $103,680 | $65,650 | 58% | 1.58 |
| Depot B improved 1.0, not 0.6 (training effect 1.2) | 72,900 | $116,640 | $65,650 | 78% | 1.78 |
| Only participant estimates available (1.672) | 101,574 | $162,518 | $65,650 | 148% | 2.48 |
| Net fuel cost $1.45 a litre | 97,200 | $140,940 | $65,650 | 115% | 2.15 |
| Net fuel cost $1.75 a litre | 97,200 | $170,100 | $65,650 | 159% | 2.59 |
| Development cost shared across both depots ($6,000) | 97,200 | $155,520 | $59,650 | 161% | 2.61 |
The fade assumption moves the answer most, from 58% to 216%, far more than the fuel price does. That points to the decision finance should care about: a refresher or ongoing telematics feedback that holds the habits may be worth more than the first course.
Three common mistakes inflate the base case like this:
| Mistake | ROI it produces | Why it is wrong |
|---|---|---|
| Credit the whole 2.2 L/100 km to the training | 226% | Depot B improved too, so part of the drop was not the training |
| Leave out participants' time ($17,550) | 223% | Drivers' hours are the largest single cost line |
| Count all 60 drivers, including the six who left | 163% | There are no data on the six, so assume no improvement |
For the finance director, I would put the low, base and high cases together:
| Case | Assumptions | ROI | Benefit-cost ratio | Payback |
|---|---|---|---|---|
| Low | Training effect 1.0 L/100 km, saving stops after month 6, fuel $1.45, costs 10% over budget ($72,215) | about -19% | 0.81 | Not repaid in year one |
| Base | $155,520 benefit on $65,650 cost | about 137% | 2.37 | A little under 4 months |
| High | 1.6 L/100 km held all year, fuel $1.75 | about 245% | 3.45 | About 3.5 months |
The honest report is "about 137%, with a plausible range from a loss of about 19% to a gain of about 245%", followed by the conservative choices that produced it. A low case below zero is not a reason to hide the range. It tells the sponsor which assumption to watch.
- The ROI and the benefit-cost ratio together, so nobody has to convert one into the other.
- The payback period, because it is the number a budget holder thinks in.
- The conservative choices, listed first: the comparison group, the six drivers left out, one year only.
- The range from the sensitivity table, with the assumption that moves it most.
- The intangibles beside the number, not buried after it.
ROI Institute's own brochure makes the trade explicit: "A conservative approach may lower the actual ROI calculation, but it will build credibility with the target audience, including the CFO." A figure the finance team trusts at 137% does more for the next budget request than one they discount from 226%. Showing a defensible number is hard, and learning teams say so.
In the CIPD's Learning at Work 2023 survey report, people in large organisations and in specialist learning functions reported it most, at 20% each. That is one in six practitioners, and one in five in large organisations, who find the number hard to defend. A range with its assumptions in plain view gives them something they can defend.
What an implausible training ROI looks like
Before you quote anyone's training ROI, including a vendor's, run six checks:
- The ROI and the benefit-cost ratio do not reconcile as ratio minus one, times 100.
- The net benefit is divided by something other than the costs.
- The benefit is revenue rather than margin or cost saved.
- Nothing separates the training's effect from everything else that changed.
- Several years of benefits are counted for a short programme.
- Participants' time is missing from the costs.
A failed check identifies a reporting or evidence problem, not a precise corrected return. Some errors can be recalculated from the printed inputs. Weak attribution or missing costs need more evidence before anyone can say how much the programme returned.

Case study: Sales training for a US health food retailer
A US health food company that sells mostly online and partly by phone trained 85 sales associates, split by lottery into a classroom group of 42 and an eLearning group of 43. Each did 16 hours of training and a 1-hour proctored exam.
- What they did: The evaluation compared unit sales of its three main products, priced at $250, $350 and $450, for one month before and one month after the training. Costs followed the Phillips cost worksheet and included participants' wages. The only isolation was a statement that the company ran no new promotions in either month.
- Evidence and result: Devarakonda’s 2019 paper reports $59,717 of training costs and $82,050 of extra first-month sales revenue. Those inputs mechanically yield a ratio of 1.37 and 37.4%, but revenue is not incremental profit. Its second method annualises $6,837.47 of first-month profit into a reported 137.4%, without deducting the training investment in the Phillips net-benefit calculation. The full-year result was not observed.
- Limitation: There was no comparison group, the benefit is revenue rather than margin, and units rose 4.2% over a single month with no check for season, stock or the other training the author says teams received.
- Lesson: Costing participants' time properly does not rescue a study with no isolation step. This is what a fragile ROI looks like, and why the depot example uses a comparison group.
An NHS England evaluation of a free online Lean course reports benefit-cost ratios of about £11 to £23 per £1 spent. These are not net ROI percentages. Counting only the 802 completers instead of all 3,462 people who viewed a component lowers the estimated benefit and the ratio to about 2.7 to 5.3; it changes the benefit numerator, not the programme-cost denominator. The benefit is alternative training cost avoided. That can be an economic benefit, but only if participants would otherwise have incurred the stated cost. The paper notes that some joined because this course was free.
"Every $1 in online training returns $30 in productivity" comes from an IBM white paper of 2008, which says Motorola estimated $30 of productivity gains within three years for every training dollar, as reported by Merrill Lynch. It is Motorola's estimate at third hand and says nothing about online training. It does not belong in a business case.
Building a course that collects the evidence
The data an ROI study needs has to be planned before the course is built, and I wanted to see whether it ever is. I looked at 104 course requests people typed into Coursebox over 90 days, 28 of them for training at work. None mentioned what the training should return, what it would cost, how its impact would be measured or who would see the results. Money came up in 13 to 18 of the 104, depending on how strictly you count, but always as the subject of the course, such as budgeting, pricing or sales. None of those briefs stated the planned monetary evaluation.
This small sample records what people typed, not their full evaluation plans. A requester may not own the budget, and the plan may live elsewhere; absence from these briefs does not establish that organisations skip ROI. A course design can provide places to collect learner responses and an initial coaching observation. Fuel records, the Depot B comparison and ROI arithmetic need separate business data and analysis. I tested only the outline and rendered pages, not facilitator marking, reporting or CSV exports.
I gave the AI builder the Depot A brief for a course I called "Fuel-Smart Linehaul Driving": 60 experienced linehaul drivers, a classroom session, about an hour online and a 3-hour coaching ride. I supplied one figure, the 50.0 L/100 km baseline, and the four habits, left the idle limit blank for the company to fill in, and told it to state no fuel saving, dollar figure, ROI or eco-driving statistic. The brief specified six numbered requirements in order, with one expanding into four habit sections: a "Before you start" page, what drives fuel use on our runs, one section per habit, the driver's own plan, a coaching checklist for the driver trainer and a wrap-up.
The first outline came back with 11 sections in the briefed order and no revision needed; the builder added framing sections such as "Programme Evidence" around the ones I asked for. What I expected to go wrong did not. I searched every page for percentages, dollar signs and savings claims, and the only figure in the course was the 50.0 L/100 km I supplied. The idle limit was left as a blank line. Three habit sections came back with branching decision scenarios and feedback, including "Build Speed Smoothly", "Set Cruise Control Safely" and "Make the Parked-Time Choice". The wrap-up told drivers the course does not measure fuel.
The issue was in the checklist the driver trainer marks after the ride. The instructions were right: addressed to the trainer, the four habits, and three marks for each, observed consistently, observed sometimes and not observed. But the rubric that grades it was generic, at 40% for observation consistency, 40% for coaching effectiveness and 20% for attention to detail. It scored the trainer's paperwork, not the driver on each habit. For an ROI file that loses the per-habit observation: nobody could read off which habits a driver showed on the ride.
The traffic-response task also came back as a 500 to 700 word assignment, and the action plan asked for about 500 words. I rewrote the traffic task as three short decisions and shortened the plan to two or three lines per habit. After reloading, the essay instructions were gone. These were separate repairs, not first-pass successes.
I replaced the rubric in the editor with one row per habit and the three levels as columns, each cell describing what the trainer would see. For anticipation, observed consistently reads "Reads traffic well ahead and eases off early on every section observed; no hard braking events". After a reload the old rubric was gone and the new one showed four habits at three levels each, which is the per-driver, per-habit record the ROI study needs.
That reload confirmed the page and rubric edits, not a facilitator’s marked record or export. The quoted “no hard braking events” criterion also needs qualification before workplace use: necessary emergency braking must never count as a failure. Judge anticipation by avoidable late reactions under the conditions. I have not retested that revised criterion or run the course with drivers.
The limits of training ROI, and the alternatives
The Phillips method has critics and qualifiers, and you should hear them out before you commit to a Level 5 study.
Kirkpatrick Partners argue that in a complex organisation results are rarely caused by one programme, so they prefer estimating training's contribution to trying to isolate it as the sole cause. Their description of the Kirkpatrick Model says "When financial return is needed, cROI offers a more credible approach than trying to isolate training as the sole cause." Contributive ROI treats training as one contributor among several. They also offer return on expectations, which "is defined by key stakeholders, what they consider success, and established in advance."
Robert Brinkerhoff, whose Success Case Method studies the people a programme helped most and least, is not against money figures but is wary of them. In the first chapter of The Success Case Method he writes: "we usually avoid making value and cost-return claims except where such claims are clearly and uncontroversially defensible."
A peer-reviewed paper on training ROI by Jasson and Govender in Acta Commercii makes the wider point that "not all training benefits can be translated into financial outcomes", and that managers who look only at the money may miss the rest.
My reading is that these are arguments about when to calculate ROI and how far to trust an isolated figure, not about whether the arithmetic works. If your sponsor wants a judgement on a whole programme rather than a figure, the CIPP model evaluates context, input, process and product. If the question is whether the training worked at all, our guide on how to evaluate the effectiveness of a training programme covers the methods short of money. Use ROI when the programme is big enough, the business measure is clear and someone will act on the number.
Putting training ROI to work
Training ROI answers a fair question with a simple formula, and the formula is the easy part. The answer depends on four choices: how you isolate the training's share, how you convert it to money, which costs you count and how long you count benefits for. A conservative version of each, shown with a range, is a number finance can use. A single percentage with no isolation step, revenue as the benefit and no participants' time is a number finance will discount.
For the next programme where a monetary estimate will inform a decision, agree the business measure and baseline, a credible comparison or other attribution method, and the full cost list before building. Record the benefit horizon and the assumptions that could change the answer. Then calculate ROI alongside the ratio, the range and non-monetised outcomes, and revisit the forecast when the workplace evidence arrives.
Frequently Asked Questions
Training ROI (return on investment) is the net monetary benefit of a training programme, after its fully loaded costs are subtracted, expressed as a percentage of those costs. It is Level 5 of the Phillips ROI Methodology, calculated as net programme benefits divided by programme costs, times 100, usually for the first year of benefits.
Follow six steps: identify the improvement in a business measure, estimate the share attributable to the training, convert that share to money, total the fully loaded costs including participants' time, list the intangible benefits, then divide the net benefit by the costs and multiply by 100. In the worked example, $89,870 of net benefit on $65,650 of costs is an ROI of about 137%.
A 20% ROI means the net benefit was 20% of the cost: for every $1 spent, the programme returned the $1 plus 20 cents. The benefit-cost ratio is 1.2. If someone reports a ratio of 1.2 as "120% ROI", they have confused the two measures.
Judge training ROI against the decision, risk and comparable alternatives, calculated with a comparison group or adjusted estimates and fully loaded costs. No published benchmark applies across programmes, so treat claims of several hundred per cent with suspicion unless the isolation step and the cost list are shown.
No. Level 5 belongs to Jack Phillips, who added a return-on-investment level to the four-level evaluation framework and set it out in his 1983 handbook. Kirkpatrick Partners prefer contributive ROI, which estimates training's contribution to a result, and return on expectations, which stakeholders define in advance.
Alex Hey
Alex Hey is a technical marketer with 10 years of hands-on growth and digital marketing experience. He cofounded Coursebox together with Travis Clapp who he met online when looking for a cofounder to build a globally impactful software product. He works in the Perth, Western Australia office as the COO. He built the world's first automated funnel for patient recruitment before building Coursebox. After launching Coursebox in mid 2023, he drove +400k organic sign ups for Coursebox. Alex leads the marketing and digital growth of Coursebox and works with the product development team bringing a passion for data-driven product decision and exceptional user experience. Alex is determined to build the world's easiest way to build the perfect course.

