
How to Create Engaging eLearning Infographics That Boost Retention
Create eLearning infographics that engage and boost retention. Use Coursebox AI to turn lessons into interactive visuals effortlessly.


Produce complex images and infographics with one click.
E-Learning infographics make online training more engaging by transforming text-heavy lessons into clear, visual content. They help learners absorb information faster, improve retention, and make courses more interactive.
In this article, we’ll cover the key benefits of using eLearning infographics, the best design practices, popular examples, and how Coursebox AI can help you automatically create professional infographics for your training programs.
Why Infographics Belong in eLearning
Infographics turn complex lessons into visually digestible content that learners actually want to engage with. Here’s why adding them to your eLearning courses works so well:
1. Visual Processing & Memory
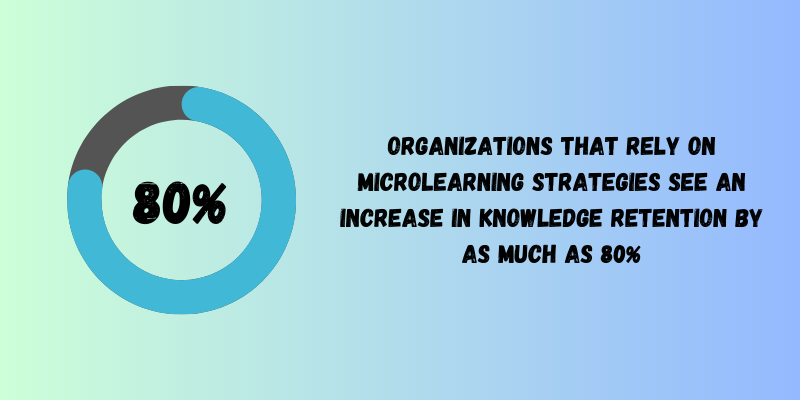
Our brains process images much faster than text, making concepts easier to understand and recall. Presenting data, timelines, or comparisons visually helps learners grasp relationships and retain key points without feeling overwhelmed.
2. Reducing Cognitive Load
Dense paragraphs or long lists of instructions can confuse learners and slow progress. Infographics condense information into bite-sized visual chunks, making it easier to absorb and apply knowledge quickly. In other words, they’re excellent for cognitive load management.
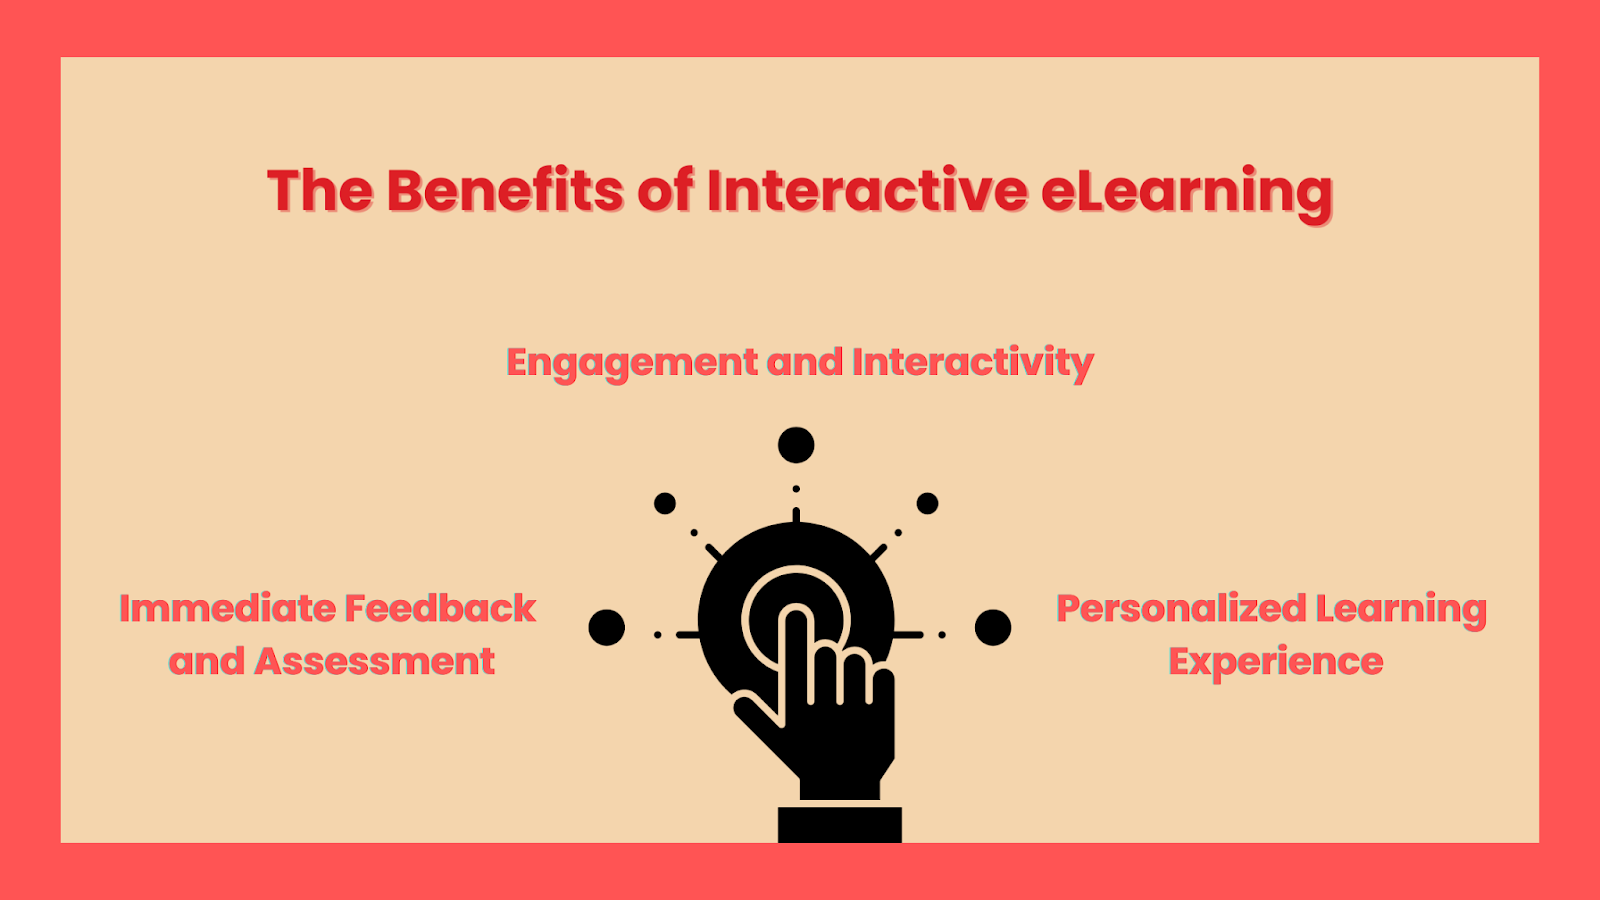
3. Boosting Engagement & Attention Span
Static text can lose learners’ focus, especially in online courses. Infographics spark curiosity, encourage exploration, and break up monotony. Learners respond to visuals because they provide immediate context and meaning, keeping motivation high throughout the course.

4. Simplifying Complex Processes
Processes, workflows, or cause-and-effect chains become clear when displayed visually. Learners can see each step in relation to the next, turning abstract ideas into tangible understanding.
5. Bridging Ideas and Concepts
When two concepts interact or overlap, infographics show connections at a glance. Visual storytelling helps learners make associations that might take paragraphs of text to explain, reinforcing comprehension and retention.
Pro Tip: Focus on clarity over decoration. Every infographic should have a purpose, highlight essential information, and use a clean, consistent design. Reputable AI infographic generators can help automate creation, turning data, concepts, or processes into polished visuals in minutes.
What Makes a “Good” Infographic in Training?
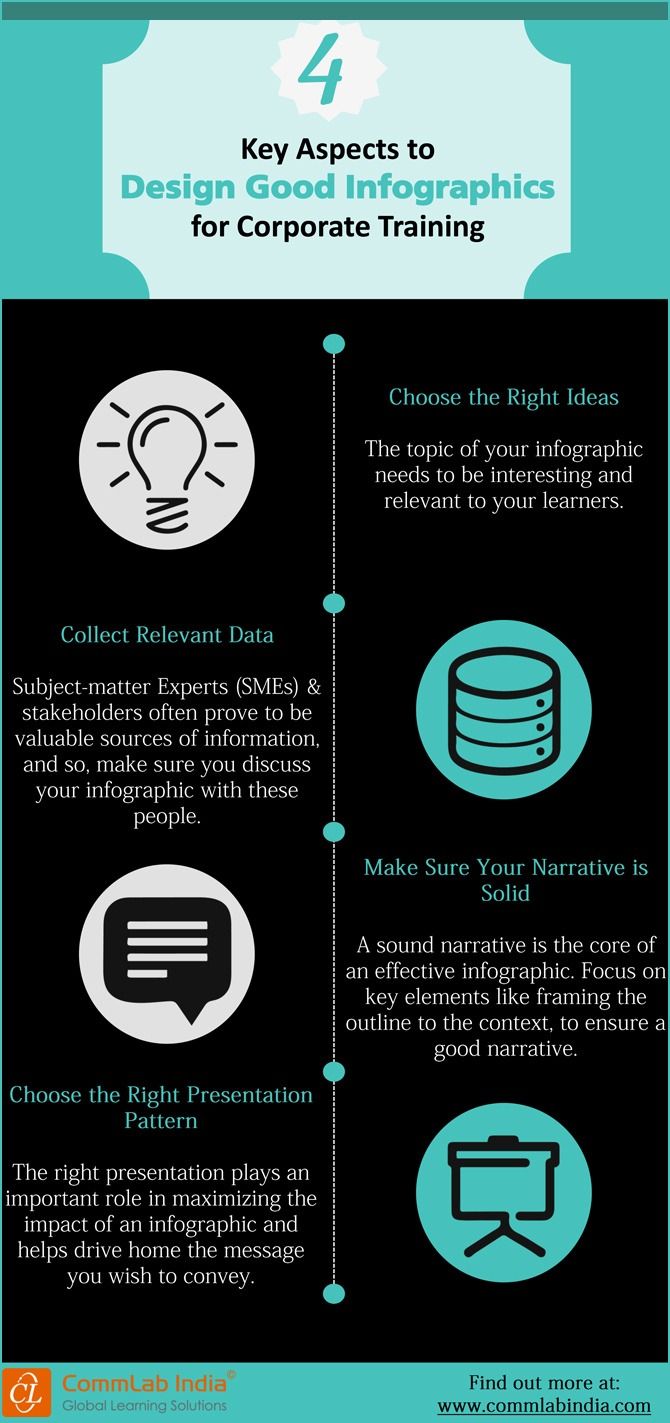
Effective infographics transform complex information into clear, engaging visuals that enhance learning. Key elements include:
1. Focus and Clarity
Each infographic should convey a single core idea. Overloading visuals with multiple messages can confuse learners and dilute the impact of the information.
2. Visual Hierarchy, Chunking, and Flow
Organize content so the eye naturally follows the information. Use headings, subheadings, and logical sequencing to break content into manageable chunks that lead learners from start to finish.
3. Color, Typography, Iconography, and Contrast
Consistent colors and readable fonts help learners distinguish information quickly. Icons or simple graphics highlight key points, while contrast ensures important details stand out on any device.
4. Simplicity vs. Complexity
Decide when to combine information into a single visual or break it into multiple infographics. Complex processes or datasets often benefit from step-by-step visuals to prevent overwhelm.
5. Accessibility and Mobile Responsiveness
Infographics must work for all learners. Include alt text, maintain readable font sizes, and ensure sufficient contrast. Mobile-friendly layouts let learners view content on any device without losing clarity.
6. Story or Narrative Arc
Infographics tell a story. Build a clear beginning, middle, and end, guiding learners through concepts, data, or processes so they can easily connect ideas and remember them later.
Pro Tip: Utilize tools like Coursebox AI to automatically format your infographic with proper hierarchy, contrast, and mobile responsiveness, saving time while keeping visuals effective and learner-friendly.
eLearning Infographic Types & Usage Scenarios
Using different types of infographics lets you match the visual format to the training goal, making information easier to absorb and retain. Here’s a breakdown of popular types and where they shine in eLearning:
1. Process/Workflow Diagram
Visualizes step-by-step procedures or workflows.
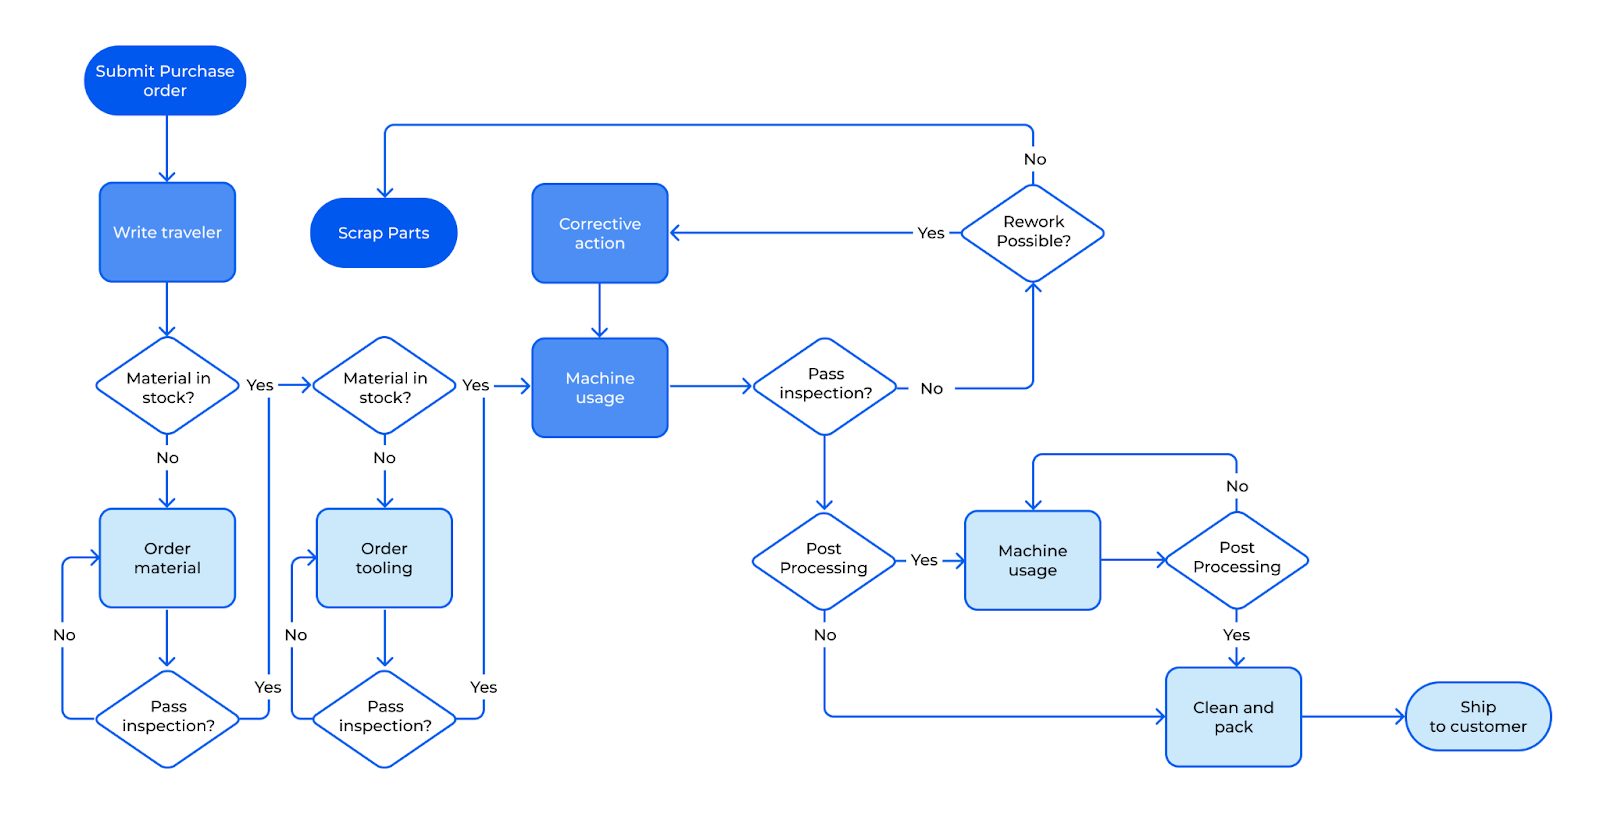
Suggested use: Compliance training, safety protocols, manufacturing processes. Helps learners understand sequences and avoid mistakes.
2. Comparison/Before vs After
Highlights differences or improvements between two states.
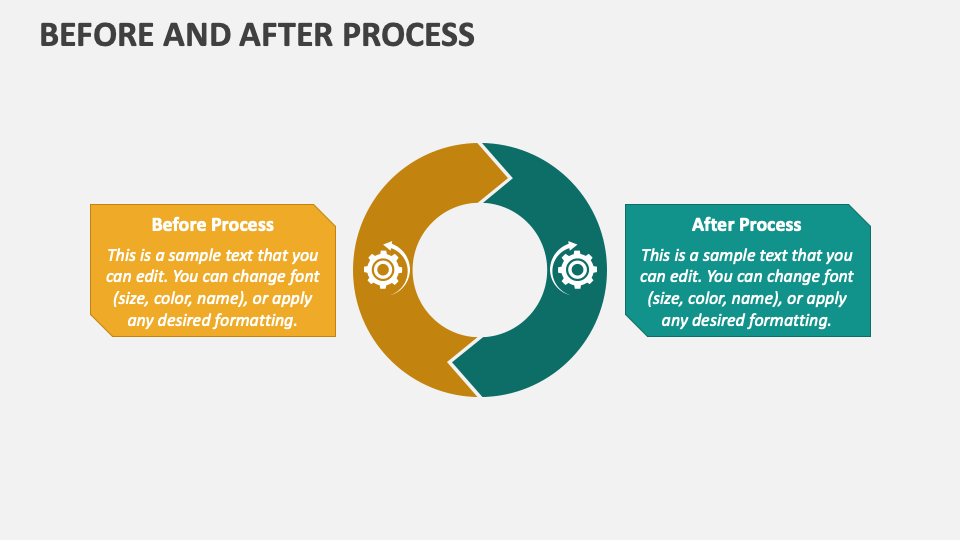
Suggested use: Change management, software updates, sales training. Shows impact clearly, helping learners grasp advantages or outcomes.
3. Timeline/Roadmap
Displays chronological events, milestones, or project phases.
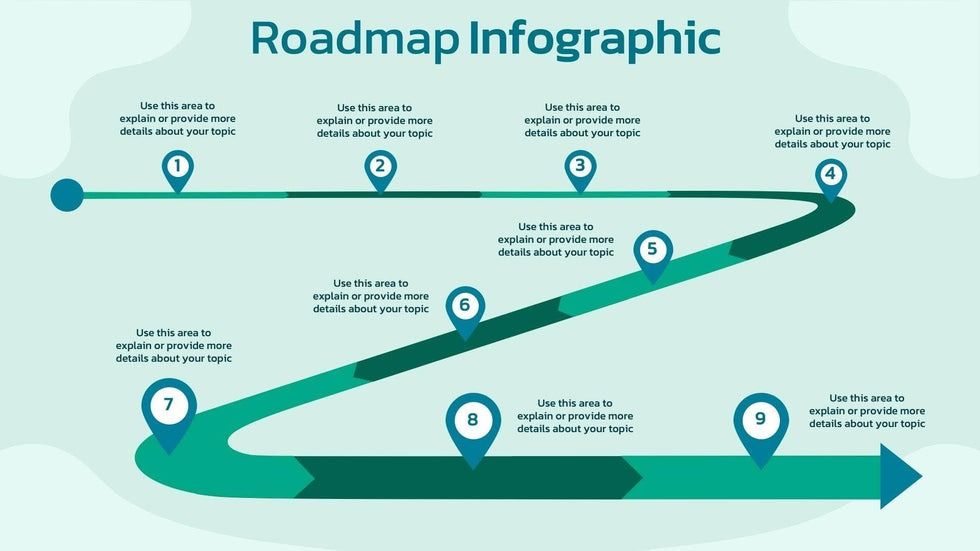
Suggested use: Onboarding journeys, project management courses, and historical context lessons. Keeps learners oriented in time and sequence.
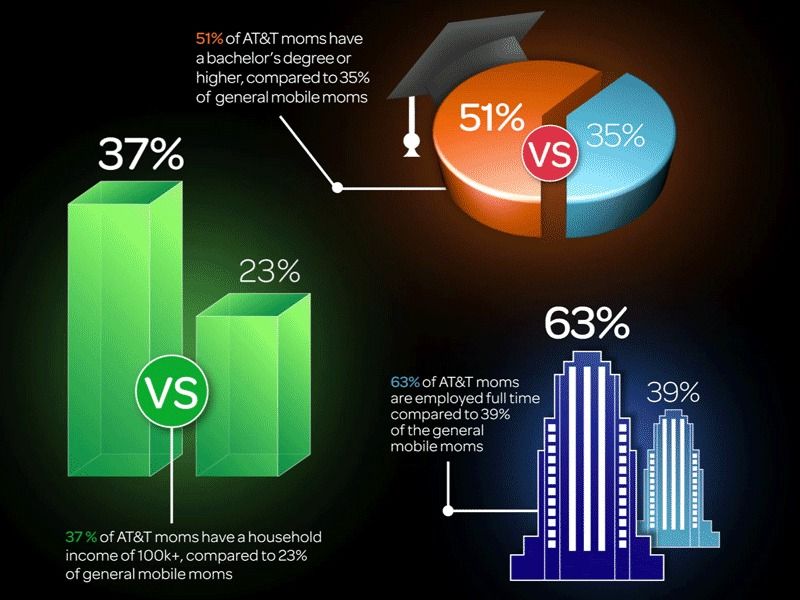
4. Data/Statistic Visualizations
Transforms numbers into visual insights like charts, graphs, or heatmaps.

Suggested use: Marketing performance reports, HR analytics, and financial training. Simplifies complex data for faster understanding.
5. Clickable/Interactive Infographics
Enables learners to explore content actively, such as hovering, expanding sections, or linking to resources.
Suggested use: Product demos, advanced technical training, or compliance scenarios. Boosts engagement and personalization.
6. Summary/Recap Infographics
Condenses key points at the end of modules or courses.

Suggested use: End-of-course review, microlearning reinforcement, or policy refreshers. Supports long-term retention.
7. Hybrid: Infographic with Embedded Microlearning Snippets
Integrates mini-quizzes, videos, or animations within visuals.
Suggested use: Interactive onboarding, blended compliance training, skill reinforcement. Encourages active learning without leaving the infographic.
How to Create eLearning Infographics
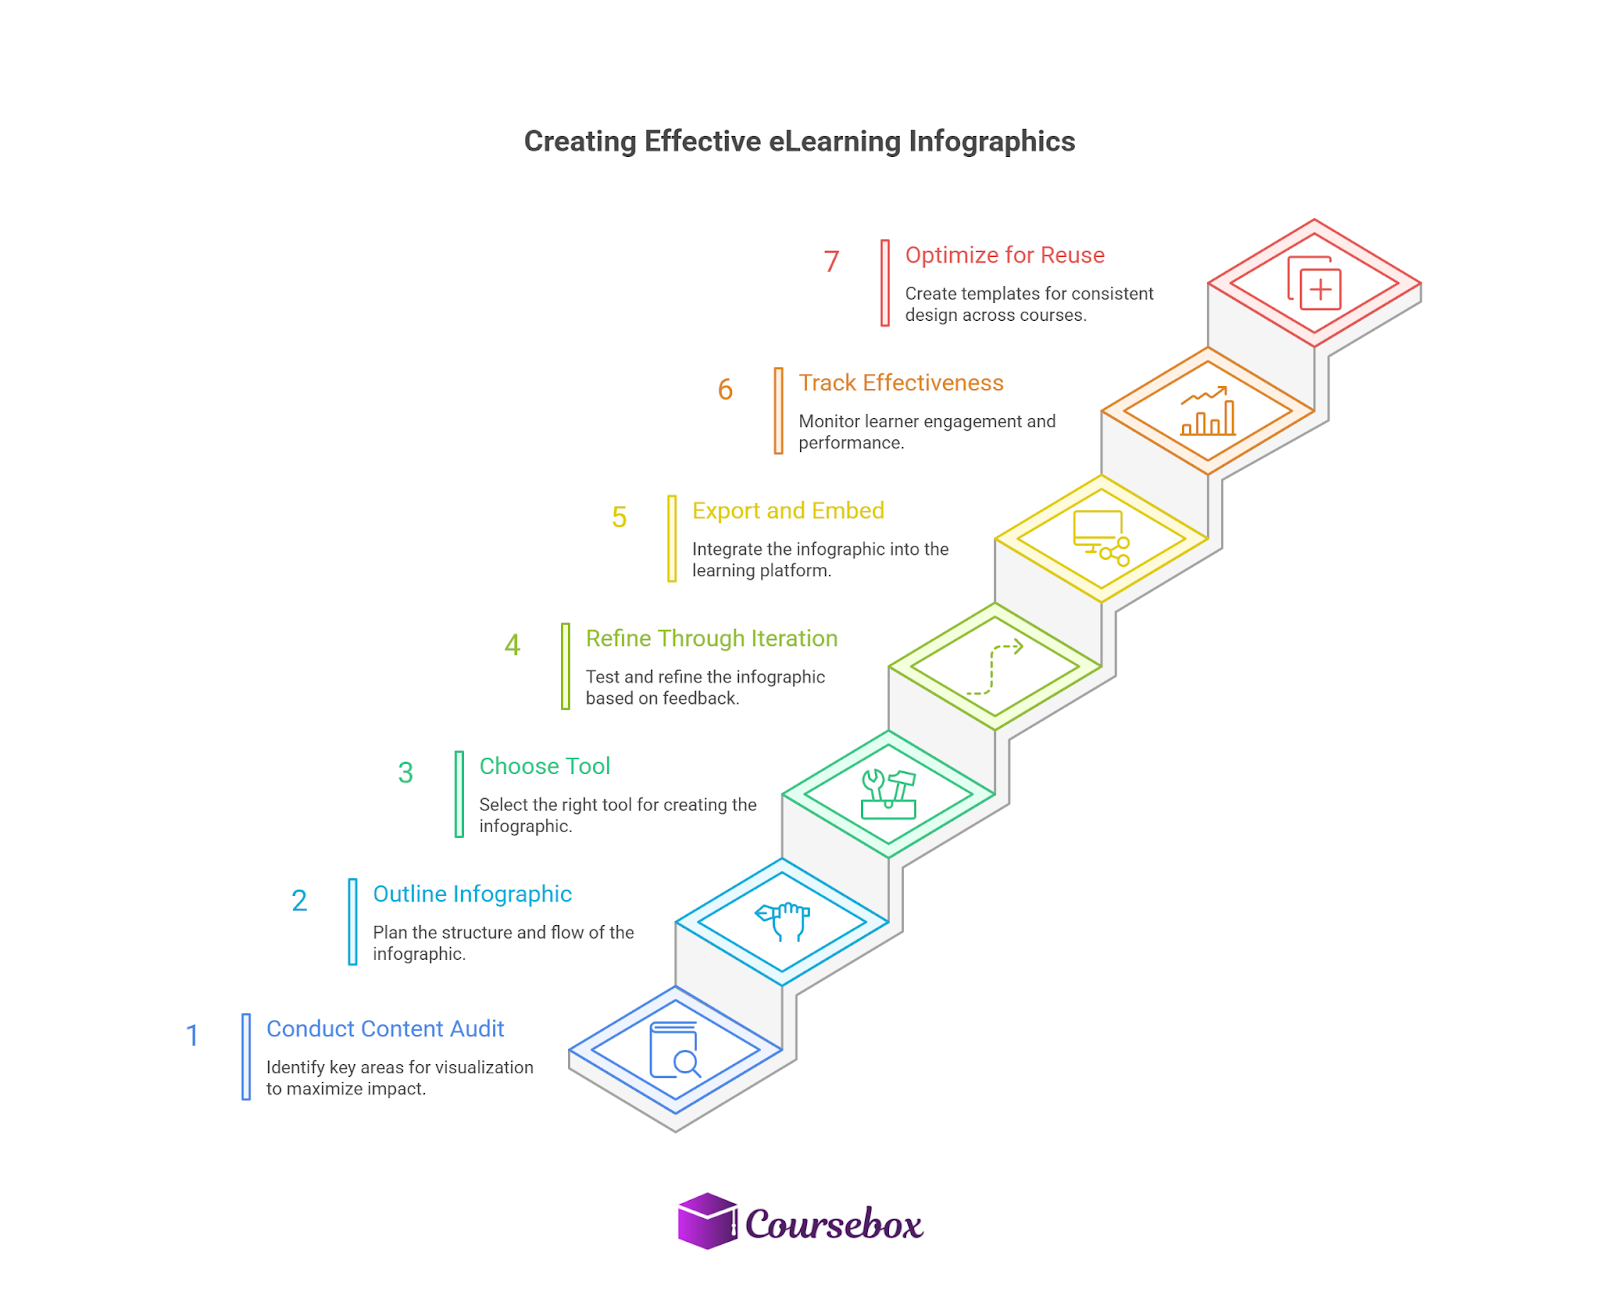
Creating effective eLearning infographics requires a structured workflow that ensures visuals support learning goals, boost retention, and engage learners. Follow these seven steps to turn complex content into clear, actionable graphics.
Step 1: Conduct a Content Audit
Identify which parts of your course or training module will benefit most from visualization. Focus on dense text, complicated processes, key statistics, or comparisons that learners struggle to absorb. Prioritizing these sections ensures visuals have maximum impact.
Step 2: Outline or Sketch Your Infographic
Map out your infographic in bullet form, organizing main points, flow, and hierarchy. This step helps maintain clarity, prevent clutter, and plan how information will guide learners visually from start to finish.
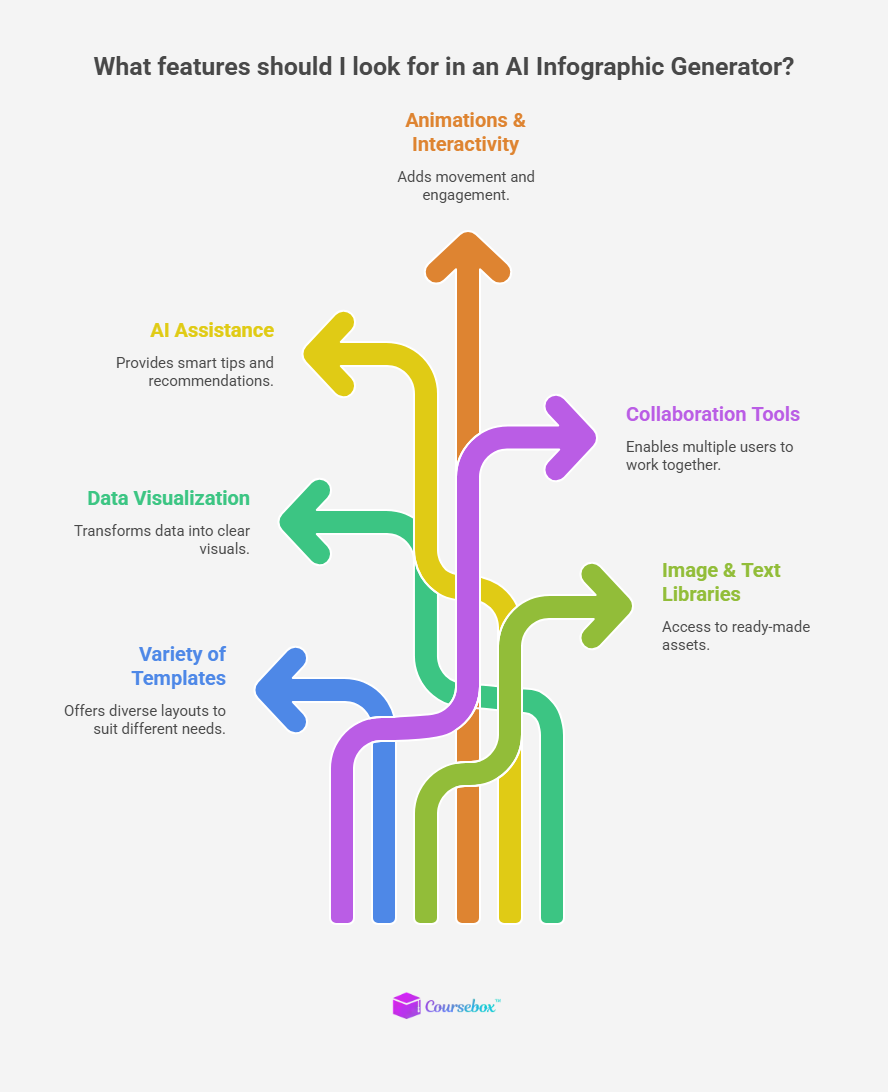
Step 3: Choose a Tool or Method
Select the right tool for creating your infographic:
- Traditional tools: Platforms like Canva, Piktochart, or Illustrator allow precise visual control and customization.
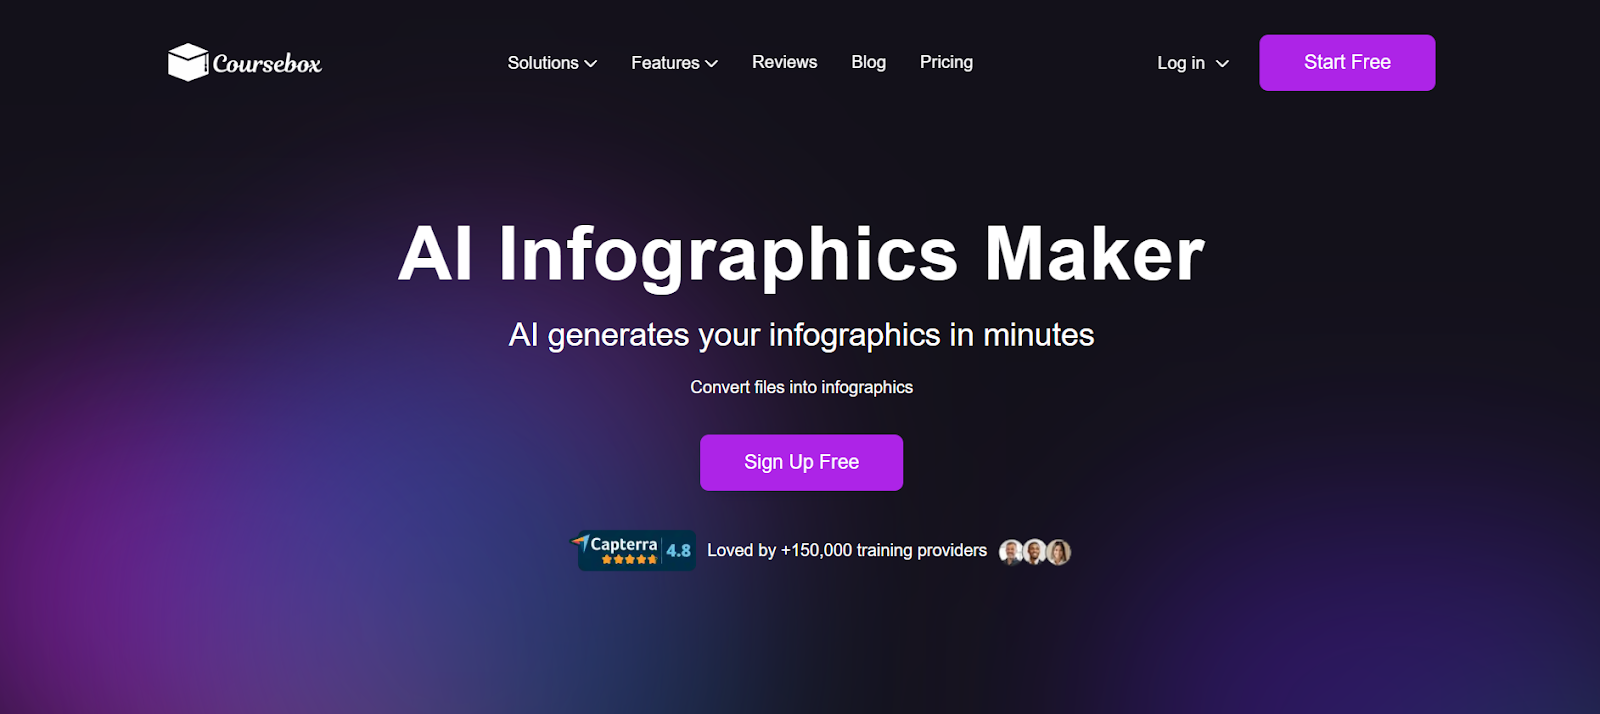
- AI tools: Coursebox AI Infographics Maker streamlines creation. Upload documents, videos, or web pages, and the tool auto-suggests layouts, icons, and text placement.
Why Coursebox AI stands out:
- Focus on content-first visuals, turning lessons into digestible graphics.
- Maintains brand consistency automatically, aligning colors, fonts, and styles.
- Integrates learning elements like quizzes, microlearning snippets, and links directly within the infographic.
Step 4: Refine Through Iteration
Test your draft with colleagues or a small group of learners. Refine layout, visuals, and text based on feedback. Multiple rounds improve clarity, engagement, and accessibility.
Pro Tip: Iteration ensures each infographic communicates ideas clearly and keeps learners engaged from start to finish.
Step 5: Export and Embed
Save infographics in formats compatible with your learning management system (LMS) or online course platform: PDF, static images, HTML embeds, or interactive embeds. Embedding visuals seamlessly within modules strengthens learning flow.
Embedding step-by-step:
- Upload the file or embed code into your LMS.
- Place it within the relevant module or slide, maintaining logical flow.
- Add interactive elements like hotspots, clickable links, or hover text.
Enhancing interactivity: Tools like H5P, ThingLink, or custom overlays can make visuals clickable, encouraging exploration. Coursebox AI also allows infographics to be integrated directly into course sequences, link quizzes, and let the AI tutor answer learner questions based on infographic content.
Step 6: Track and Measure Effectiveness
Monitor how learners engage with each infographic. Key metrics include:
- Engagement: clicks, interactions, and hotspot usage
- Time on infographic: dwell time per visual
- Module completion: course or lesson completion rates
- Quiz and assessment performance: knowledge retention
- Learner feedback: satisfaction ratings and qualitative comments
Run A/B tests comparing infographic-driven modules with traditional content. Use dashboards and analytics to identify weak points, confusing visuals, or content gaps. Iterate regularly to refine graphics, simplify information, reorder sections, or remove distractions.
Step 7: Optimize for Reuse and Consistency
Once your infographics perform well, create templates or reusable components to maintain a consistent design across courses. This saves time, ensures brand alignment, and allows quick updates when course content evolves.
Pro Tip: Using Coursebox AI, you can generate multiple infographics in minutes while maintaining visual and instructional consistency across your training programs.
Create Smarter eLearning Infographics with Coursebox AI Today
Visuals transform learning.
Well-crafted infographics simplify complex content, keep learners engaged, and improve retention across any eLearning course.
Start small: pick one infographic, embed it in a module, track how learners interact, and refine based on results. Each step teaches you what works best for your audience.
Coursebox AI makes the process effortless. Automatically generate professional, on-brand infographics, embed them directly into your LMS, and even link interactive elements or quizzes, all in one place.
Take action today: build your first eLearning infographic with Coursebox AI to see how easy it is to enhance your training content.
FAQs
Can eLearning infographics improve knowledge retention long-term?
Yes, using visuals to summarize key concepts helps learners recall information faster and retain it longer, especially when paired with interactive elements or follow-up quizzes.
How do infographics support different learning styles?
Infographics appeal to visual learners, reinforce reading/writing learners with clear text, and aid kinesthetic learners when paired with interactive elements or workflow simulations.
What file formats work best for interactive eLearning infographics?
Interactive infographics perform best as HTML5, embedded iframes, or interactive PDFs, while static visuals can use PNG or JPEG depending on LMS compatibility.
How often should eLearning infographics be updated?
Update visuals whenever content changes, every 6–12 months, or after analyzing learner engagement data to ensure accuracy, relevance, and continued effectiveness.
Can infographics be used for assessments in eLearning?
Yes, hotspots, clickable areas, and embedded quizzes can turn infographics into assessment tools, allowing learners to demonstrate understanding while interacting with the visual content.
Alex Hey
Digital marketing manager and growth expert

