

8 Best AI Infographic Generators in 2026 (That Actually Make Editable Infographics)
The 8 best AI infographic generators in 2026, judged on one thing: do they make an editable infographic from your text or data, or just a flat image?

A real AI infographic generator turns your text or data into an infographic you can edit, rebrand and download. An AI image generator only makes a flat picture of one that you cannot change. That difference is the whole point.
- Match the tool to what you are starting with. If you have a block of text, Piktochart, Napkin or Gamma will draft it. If you have data, Infogram or Visme build the charts. For general design, Canva, and Adobe Express if you already work in Adobe.
- Napkin is the best free pick, with unlimited PNG and PDF downloads. Watch one free-tier catch: Venngage and Infogram let you design for free but not download, so you pay just to get a file out.
- Skip AI image generators like DALL-E, Midjourney, Firefly and Microsoft Designer for infographics. They make pictures, not editable graphics, so the text and data are fixed in place. Use them for illustrations instead.
- Whatever tool you use, the AI gives you a draft, not a finished piece. Budget ten minutes to fix the charts and check every number against your real source.
Answer three quick questions and I will point you to the right one for what you are making.

Produce complex images with one click
There are a lot of tools in the market right now who claim to be AI infographic makers. Not all of them do what their marketing claims though.
A real AI infographic generator takes your text or your data and builds an infographic you can actually edit: fix the wording, correct the figures, swap the colours to your brand, and export a file you own.
I am Parshad, and I make infographics most weeks, for blog posts, internal slide decks and reports. So I judged these on whether they turn your content into an editable infographic, or just hand you a pretty image? I have been honest about the free tiers, the watermarks and the catches, and at the end I name the tools that are really AI image generators, not infographic tools.
One disclosure up front: Coursebox, where I work, makes an AI infographics maker too. I have kept it out of the neutral ranking below to stay fair, and I come back to where it fits at the end.
A quick reminder of why a good infographic is worth the effort: the brain reads an image far faster than a block of text, and remembers it far longer.
How I judged these AI infographic generators
Five questions, in the order that decides whether you get something usable.
Editable, or just an image? This is what I . Can you fix the text, correct the numbers and rebrand it, or is it a flat picture with baked-in gibberish? I weighted this heaviest.
What it is best at. Turning text into an infographic, turning data into charts, or general design. The wrong type for your job wastes your afternoon.
Free for you, really? Most people want this free, so I checked what the free plan actually lets you do: download a file or share-only, watermark or not, how many designs.
Templates and polish. How good the starting point is, and how much fixing it needs before it is presentable.
Price, real numbers, per tool.
AI infographic generators at a glance
Prices are in USD as of August 2026 and change often, so check before you pay.
| Tool | Best for | Editable infographics? | Free tier | Price |
|---|---|---|---|---|
| Piktochart | Turning text or a PDF into an infographic | Yes, fully editable | 2 PNG downloads, 60 AI credits, watermark | Pro from $10/mo |
| Canva | General design with the biggest template library | Yes, fully editable | Free; 200 AI uses, premium gated | Pro ~$15/mo |
| Venngage | Business and report infographics | Yes, editable | 5 designs, share-only (no download) | Premium from $10/mo |
| Infogram | Data-driven infographics and live charts | Yes, plus live data | 10 projects, no downloads (public only) | Pro from $19/mo |
| Napkin | Fast, free visuals from your text | Yes, editable | 500 AI credits/week, unlimited PNG/PDF | Plus from $9/mo |
| Visme | Interactive infographics with data widgets | Yes, AI assists | Unlimited projects, JPG/PNG/PDF, watermark | Starter from $12.25/mo |
| Gamma | An AI-generated visual one-pager from a prompt | Yes, editable cards | 400 credits, PDF/PPTX/PNG export | Plus from $9/mo |
| Adobe Express | Adobe users wanting quick branded graphics | Yes, editable | Free tier, premium content watermarked | Premium ~$9.99/mo |
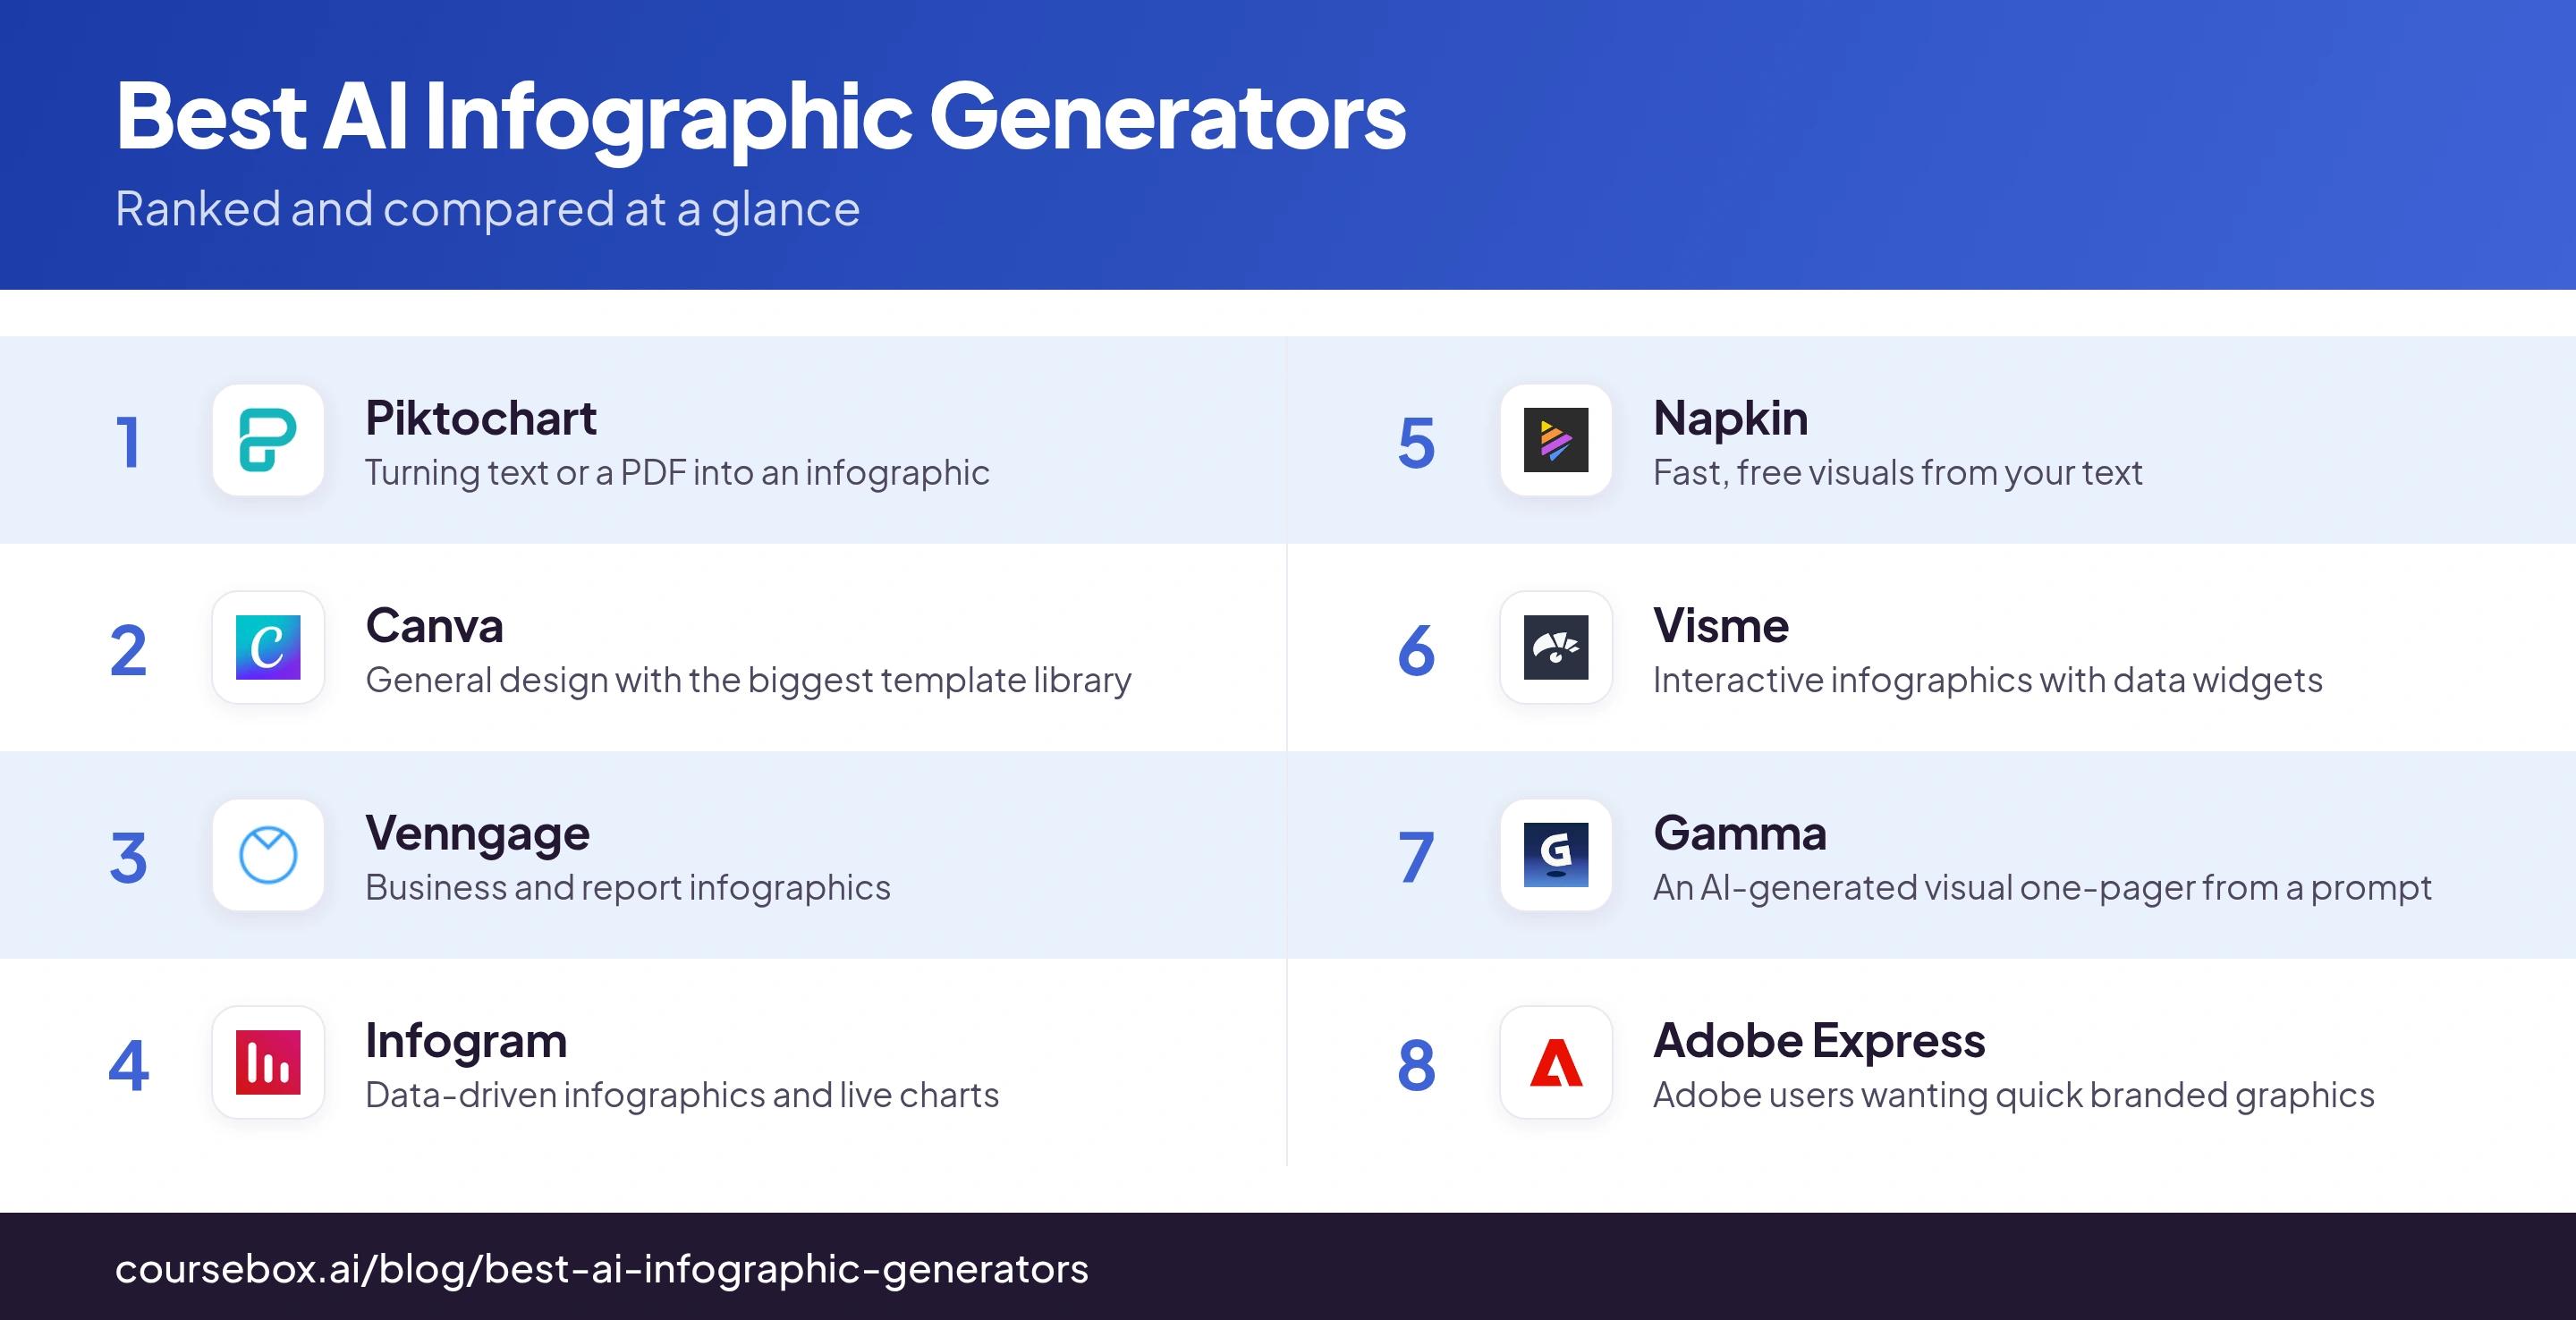
The 8 best AI infographic generators
1. Piktochart
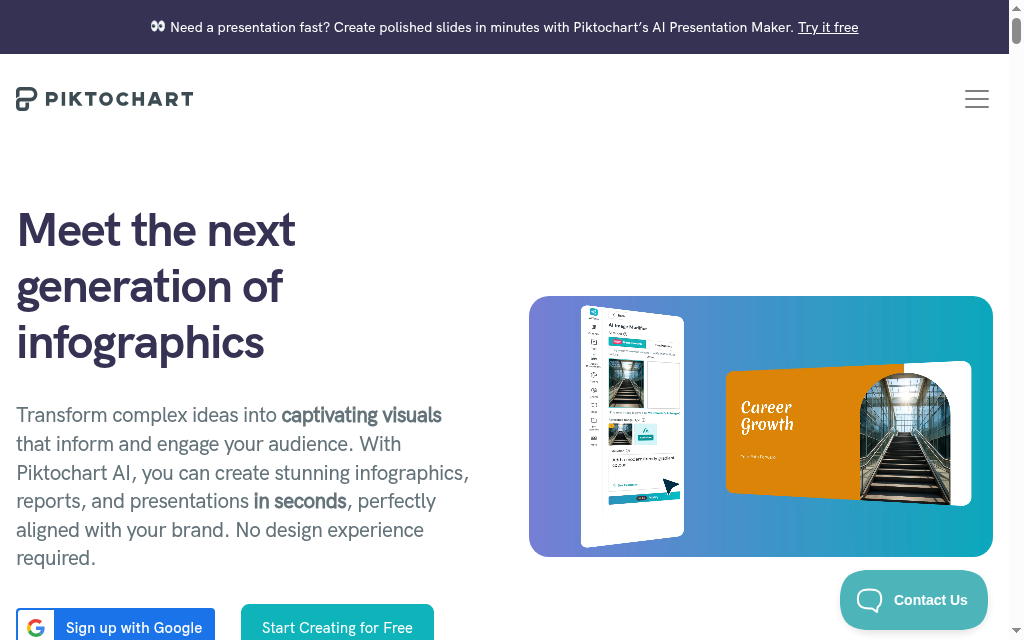
Best for: Turning your text, or a whole PDF, into an editable infographic.
Piktochart is the closest thing here to a true text-to-infographic tool. You type a prompt, paste your text, or upload a PDF, and it structures your content into editable infographic templates in seconds, with every element you can move, reword and rebrand.
What it makes: A fully editable infographic, not a flat image. This is the one it does best.
Free for you: The free plan gives 2 PNG downloads, 60 AI credits and unlimited projects, with the Piktochart logo on free exports.
Price: Free; Pro from $10/month (billed annually, $15 monthly).
How to use it well: Paste your text or a PDF and let it build the draft, then go straight to the charts and fix the labels before you export.
Notes from testing: I feed it my own numbers and the auto-generated charts come back with the labels overlapping, so the data is hard to read. Treat its charts as a rough draft to tidy up, not a finished asset, though the editor itself is quick to work in.
Verdict: The best pick when you have the words or the data and want an editable infographic out the other end.
2. Canva
Best for: General design, with a template library nothing else here matches.
Canva is the one most people already have open. Its Magic Design turns a prompt into a starting layout, and behind it sits an enormous library of infographic templates you edit by dragging things around.
What it makes: A fully editable design. The AI output is a starting point, not a finished piece.
Free for you: Free covers a huge amount, but AI is capped (around 200 standard uses) and the best templates and elements are gated to Pro.
Price: Free; Pro around $15/month.
How to use it well: Use Magic Design for the skeleton, then swap in your own data and text, and build with free elements from the start.
Notes from testing: The catch that got me is that you cannot filter elements by price, so you pick a graphic you like and hit a Pro paywall halfway through building. Lovely tool, just budget for the upsell or stick to free assets.
Verdict: The safe, familiar choice for general infographics, as long as you expect a nudge toward Pro.
3. Venngage
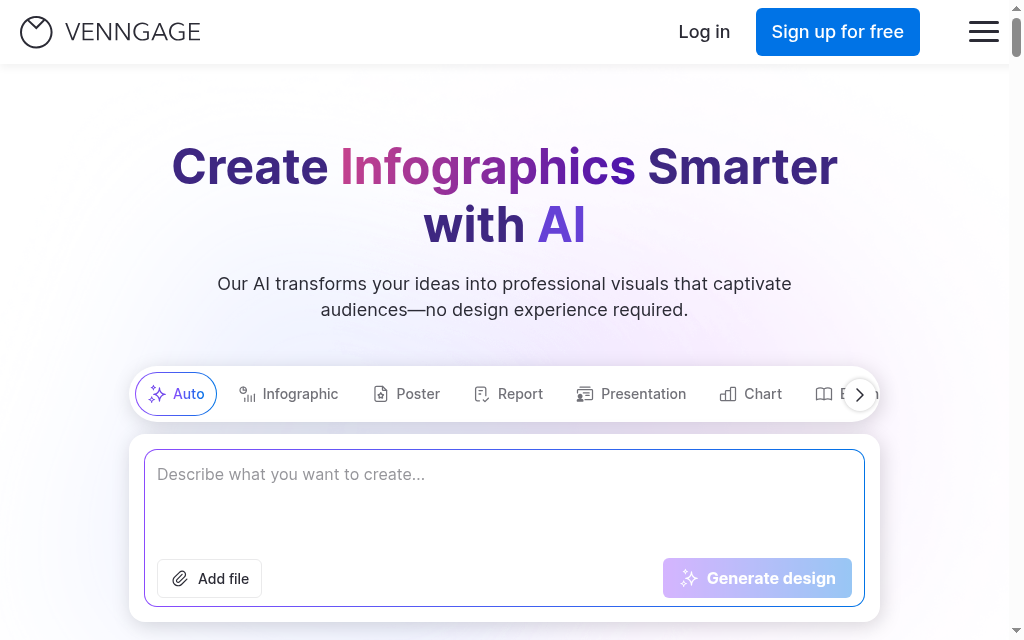
Best for: Business, report and data infographics for work.
Venngage is built for the office: thousands of business and report templates, a brand kit that drops in your logo and colours, and a text-to-infographic feature that turns a document into a draft.
What it makes: An editable infographic, though the free plan changes how you get it out (below).
Free for you: Free gives 5 designs, but you cannot download them, you share a public Venngage link, often with their branding. Exporting a file starts at Premium.
Price: Free (share-only); Premium from $10/month (billed annually).
How to use it well: Paste your report text for the draft, but if you need an actual file to send, plan to be on Premium, the free share-link is the real catch.
Notes from testing: The free plan surprised me: I made a design I liked and then found there was no download button, only a public link. Fine for a quick share, useless if you need a file you own.
Verdict: A strong choice for polished business infographics, if you will pay to export.
4. Infogram
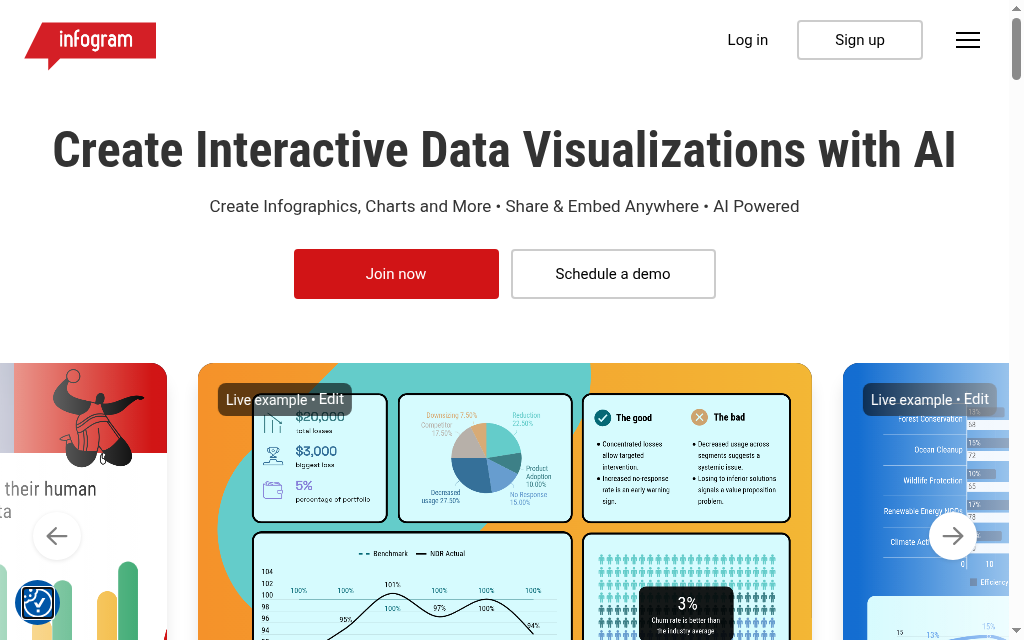
Best for: Data-driven infographics and charts that update themselves.
Infogram (by Prezi) is the data specialist: 35-plus interactive chart types, hundreds of maps, and live connections to Google Sheets or an API so your charts refresh when the data does.
What it makes: Editable, data-bound infographics, the charts are real and interactive, not pictures.
Free for you: Free gives up to 10 projects but no downloads, your work stays public or embed-only. Exporting a file needs a paid plan.
Price: Free (public only); Pro from $19/month (billed annually).
How to use it well: Connect your spreadsheet so the charts stay live, but keep the dataset light, it slows down on heavy data.
Notes from testing: It handles a normal dataset well, but the moment I threw a heavier set of data at it, the editor slowed down and glitched. Keep it lean and it is excellent for data stories.
Verdict: The one to reach for when the infographic is really about the data.
5. Napkin AI
Best for: Fast, free visuals from a block of text.
Napkin AI takes your writing and turns it into visuals, diagrams, simple infographics and charts, in a couple of clicks, then lets you edit and export them. It is fast, and free to get real files out.
What it makes: Editable visuals, though they lean toward diagram-style layouts.
Free for you: Generous: 500 AI credits a week, unlimited PNG and PDF export, with a small Napkin watermark on the free plan.
Price: Free; Plus from $9/month.
How to use it well: Give it clean headings and bullet points, not a freeform request, it thinks in structured visuals and needs the structure from you.
Notes from testing: I asked it for a simple banner with just a title on it and got back another diagram, because structured visuals are all it really makes. Feed it a tidy outline and it is quick and free; ask for something freeform and it will not budge.
Verdict: The best free option for turning notes into a shareable visual, within its diagram-shaped comfort zone.
6. Visme
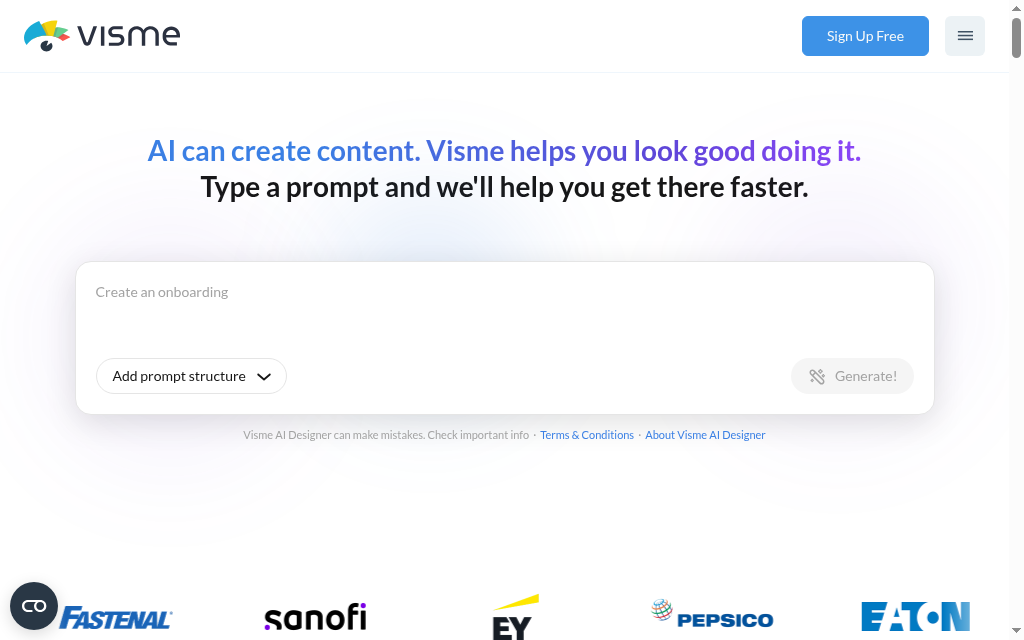
Best for: Interactive infographics with real data widgets.
Visme is a design platform with strong infographic tools: 50-plus chart types and data widgets, an AI designer for the layout, and charts that update as you edit the numbers or sync from a sheet.
What it makes: Editable infographics, with the honest caveat below about how much the AI actually does.
Free for you: Free gives unlimited projects and JPG, PNG and PDF downloads, with a Visme watermark until you upgrade.
Price: Free; Starter from $12.25/month (billed annually).
How to use it well: Start from a template and lean on the data widgets, do not expect the AI to generate the whole infographic from a prompt.
Notes from testing: Two things I hit. Visme's own help says the AI cannot actually generate an infographic for you, it is templates plus data widgets, so the "AI infographic generator" label oversells it. And the editor gets slow and laggy on bigger projects. The live-data charts, though, are the best part.
Verdict: A capable interactive-infographic builder, as long as you know you are doing more of the work than "AI generator" implies.
7. Gamma
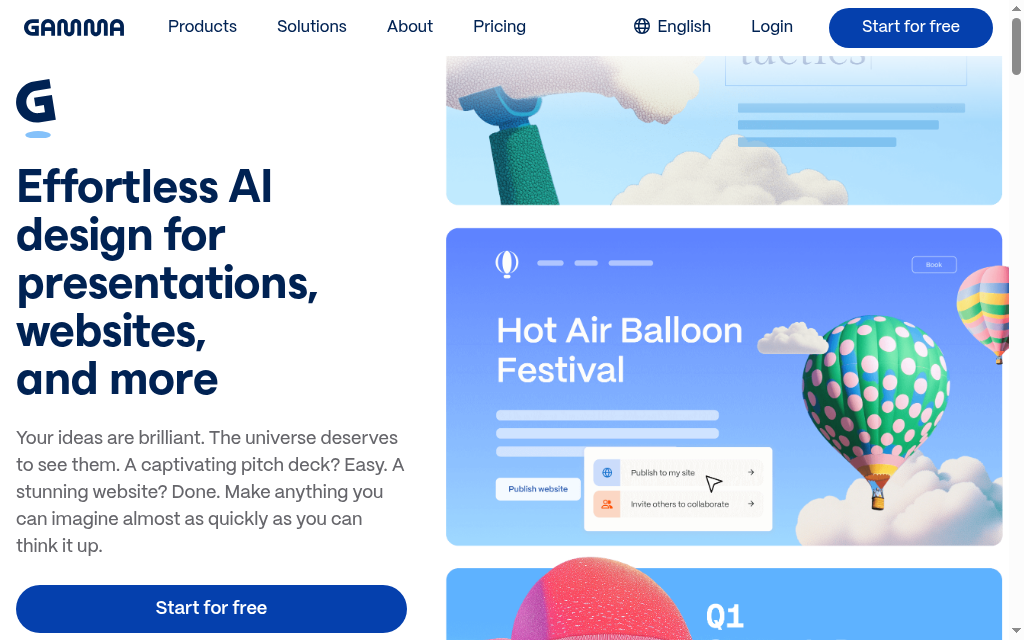
Best for: An AI-generated visual one-pager from a single prompt.
Gamma is deck-first, but you can prompt it for a one-page visual document or graphic and it generates a whole draft, cards, layout and images, that you then edit. It is the fastest way here from a prompt to something shareable.
What it makes: Editable card-based visuals; strong on layout, weaker on data.
Free for you: Free gives 400 one-time credits and PDF, PPTX and PNG export.
Price: Free; Plus from $9/month (billed annually).
How to use it well: Prompt it for the structure and the words, then fix the charts by hand, its data visuals are the weak spot.
Notes from testing: It is deck-first and it shows on data: the pie charts came out with no value labels, and when I added them they were barely readable. Great for a quick, good-looking one-pager, not for anything data-heavy.
Verdict: The pick when you want a polished visual page from a prompt and the data is simple.
8. Adobe Express
Best for: Adobe users who want quick, on-brand graphics.
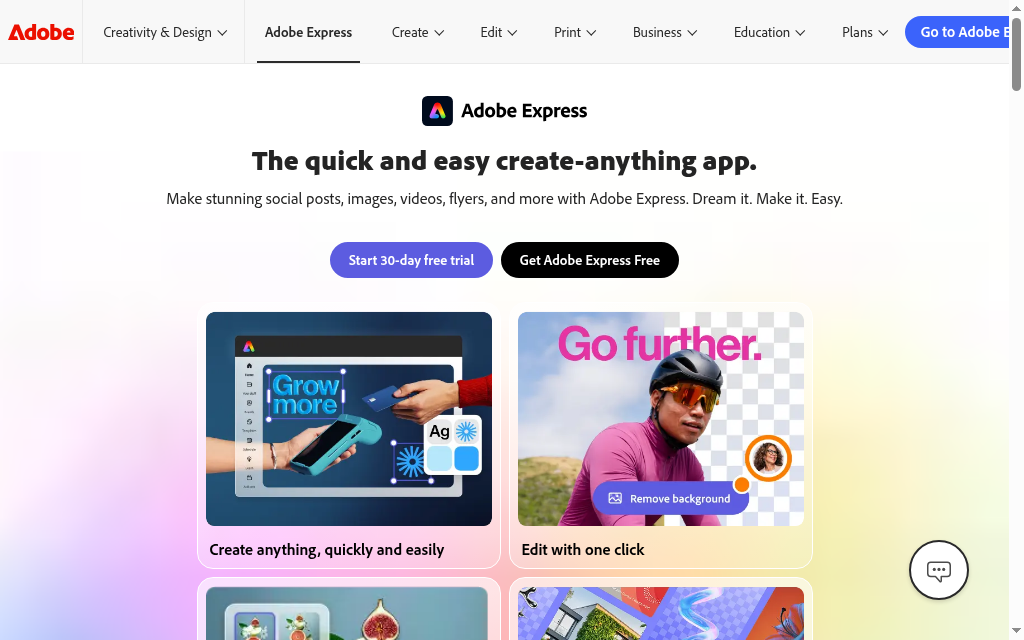
Adobe Express pairs a big template library with Firefly generative AI, so you can build an infographic from a template and drop in AI images, all inside the Adobe ecosystem with brand kits.
What it makes: Editable graphics; more general design than a dedicated infographic engine.
Free for you: There is a free tier, but premium content is watermarked and generative AI is credit-limited. Verify the current free limits on Adobe's pricing page.
Price: Free tier; Premium reported around $9.99/month.
How to use it well: Start from an infographic template rather than a blank prompt, and untick the watermark box before you export.
Notes from testing: The one that caught me is a sticky "Scan Me" watermark that kept getting added on save, with an upgrade prompt, and it stayed even with the watermark option turned off. Check your export carefully before you ship it.
Verdict: A solid choice if you already live in Adobe, less so as a purpose-built infographic tool.
The tools to avoid: image generators are not infographic generators
The biggest mistake I see is reaching for an AI image generator to make an infographic. DALL-E, Midjourney, Adobe Firefly and Microsoft Designer are brilliant at making images, and they will happily produce something shaped like an infographic. But it is a picture: the text comes out as garbled nonsense, any numbers are invented, and you cannot edit a word of it. You cannot fix the typo, correct the figure or put it in your brand colours, because there is nothing underneath to edit. Use them for a hero image or an illustration. For anything with real words or real data in it, use a tool from the list above.
Before you trust any AI infographic tool, try to edit the text. If you can click a word and change it, it is a real infographic generator. If the text is baked into a flat image you cannot touch, it is an image generator, and any numbers in it are probably invented.
Making an infographic to teach or train?
One of these tools is ours, and I kept it out of the ranking to stay neutral. Coursebox makes AI infographics too: a flowchart, timeline or comparison chart from a single sentence, editable and downloadable as a PNG. Its real edge is not the graphic itself, it is what surrounds it. The infographic drops straight into a training course, with a quiz built around it and an AI tutor to answer learners' questions. So if your infographic is really teaching material, for learners or new hires, it is worth a look; for a standalone graphic, the focused tools above will serve you better. The interactive side is not a niche feature:
How to choose the right AI infographic generator
Start from what you are turning into an infographic
If you have a block of text, Piktochart, Napkin or Gamma will draft it. If you have data, Infogram or Visme keep the charts live and editable. If you just want to design one by hand with AI help, Canva or Adobe Express. Match the tool to your raw material and you skip most of the frustration.
Check you can actually download it, free
The free-tier trap is not the watermark, it is the export. Venngage free is share-only, and Infogram free is public-only, so you cannot get a file out without paying. Napkin, Visme and Piktochart do let you download on free (with a watermark). Know which you are on before you build.
Judge the AI by what you have to fix
Every tool here calls itself an AI generator, but the AI does very different amounts. Piktochart and Gamma actually draft the thing; Visme's own docs admit its AI will not generate an infographic for you. Assume you will fix the charts and the wording, and pick the tool whose draft leaves you the least to fix.
Never ship the fake numbers
Whatever tool you use, if the AI put numbers in your infographic, check every one against your real source before it goes out. AI drafts invent figures with total confidence, and an infographic makes a wrong number look authoritative.
Which AI infographic generator should you pick?
If you take one thing from this, make it the editable test: a real generator gives you something you can fix and rebrand, not a flat image with fake text. For turning text into an infographic, start with Piktochart. For data, Infogram. For a fast free visual, Napkin. For general design, Canva. And keep the AI image generators for images, not infographics. Whatever you pick, the AI gets you a draft, not a finished piece, so budget ten minutes to fix the charts and check the numbers.
Frequently Asked Questions
An AI infographic generator turns your text or data into an editable infographic: you give it your content, it drafts a layout with charts, icons and text, and you edit it and export a file. The key word is editable. A tool that hands you a flat image with uneditable text is an AI image generator, not an infographic generator, even if the picture looks like an infographic.
For genuinely free files, Napkin is the standout: unlimited PNG and PDF export on the free plan, only a small watermark. Canva and Visme also let you download on free (with a watermark), and Piktochart gives you 2 free PNG downloads. Watch out for Venngage and Infogram, whose free plans let you design but not download.
Yes, and this is where the specialist tools earn their place. Infogram and Visme connect to a spreadsheet and build editable, live charts that update when your data changes. A general chatbot or image generator cannot do this reliably, it will often invent numbers rather than use yours, so always check the figures.
Yes. Piktochart, Napkin and Gamma are built for text-to-infographic: paste your writing or a document and they draft a visual you then edit. Give them structured text, headings and short bullet points, and the drafts come out far better than a wall of prose.
Because you used an AI image generator (like DALL-E, Midjourney or Firefly), not an infographic tool. Image models paint a picture of text rather than setting real, editable text, so words come out garbled and numbers are made up. A real infographic generator uses actual text and data you can read and edit, which is why the distinction matters.
Most export PNG and PDF; several add JPG, and a few add PPTX or SVG. Napkin does PNG and PDF free, Gamma adds PPTX, and Infogram and Venngage gate downloads behind paid plans (their free tiers are share or embed only). If you need a specific format, check it on the tool's own page before you commit.
Not long for a first draft. The AI part is fast: paste your text or data and most tools lay out a draft in under a minute. The time goes into editing. Fixing labels, swapping icons, matching your colours and correcting any numbers the AI guessed usually takes 15 to 30 minutes. A simple one-panel graphic can be done in about 10 minutes, while a dense, data-heavy one with custom branding can take an hour or more.
Parshad Desai
Driving growth and marketing strategy at Coursebox AI

